What is a false breakout in Forex trading?

When the price breaks an important zone only to retreat shortly after and hit your stop-loss is a known pain for every breakout trader. False breakout in Forex traps traders who enter on the breakout and then forces them out when the move fails to actually continue in the breakout direction. Fakeouts are frequent in Forex and other financial markets, which makes it crucial for traders to understand when and how they occur to develop effective filters. Spotting warning signs when breakouts happen greatly increases the chances of detecting false breakouts early and avoiding whipsaws. Let’s analyze the false breakout meaning in more detail below and provide everything you need to trade breakouts proficient in Forex.

Start Trading in 10 Minutes

Apply everything you’ve learnt on a real trading account with up to 1:2000 leverage, negative balance protection and outstanding support.
Get Started

False breakouts in Forex explained

A false breakout occurs when the price briefly touches and exceeds a support or resistance level but closes back within the previous range. It signals that breakout failed and traders often call false breakouts fakeouts. Such failures of price from time to time indicate a continuation of the prior trend or an imminent reversal, which makes it absolutely crucial for traders to spot these fakeouts. To see a clearer picture and truly understand the false breakout meaning, we should also list crucial terms for fakeouts:

  • A clear breach of technical barriers such as horizontal level, trendline, channel edge, or chart pattern on a chosen timeframe. 
  • Close back inside the range or pattern which negates prior breakout.
  • A swift retracement that often traps breakout traders on the wrong side of the market. 

Price-action characteristics of false breakouts

A long wick is typical for false breakouts where the long wick is beyond the zone and is followed by a full-body reversal candle. The close inside the previous support and resistance zone invalidates the breakout as well and frequently occurs during fakeouts. Price might also experience a rapid rollback within 1 or 2 candles which strengthens the fakeout. 

Fakeout psychological drivers

trading false breakouts can be very frustrating as major breakouts are often hunted by larger players. The main reason for traders getting into fakeouts is psychological, they do not want to miss the opportunity. This phenomenon is known as the fear of missing out or FOMO and is a major cause of losses when using breakout methods. 

Liquidity is crucial when breakouts happen. If the breakout is not supported by strong volume, then it might fail because there is not enough follow-up from traders. 

These factors create an environment where traders can easily fall victim to fakeouts. 

Fakeouts versus true breakouts - What’s the difference?

Surely, some percentage of breakouts are true breakouts that start a new trend or reverse an already established trend. Since trading false breakouts ends in losses, trailers should learn how to spot true breakouts. Here are the main signs of a strong breakout:

  • The candle closes well beyond the support or resistance level in the breakout direction.
  • String surge in volume and or momentum confirms the breakout.
  • Multiple candles continue in the breakout direction, making a strong follow-through.
  • Breakout happens across multiple timeframes and not just on a single timeframe, confirming the breakout. 

Knowing these signs is critical to reducing the amount of false signals and catching every valid breakout. True breakouts often align with major trend direction, fundamental analysis, or clear shifts in market structure. 

Traders can use volume and momentum indicators to evaluate the power of bulls and bears behind every breakout. Popular momentum oscillators include MACD and RSI and when there is a breakout but the indicator is not agreeing with it, it is probably a fakeout and should be avoided. By evaluating these factors before entry, traders can catch valid breakouts and avoid most fakeouts. So, these indicators could be considered as false breakout indicators. Let’s now switch to indicators that can be used to detect fallouts and explain how to use them as confirmation tools. 

False breakout indicators and tools

Since breakout trading is popular among traders, there are many tools developed over the years to spot them on the chart and even get notifications and alerts. Some of the tools are also useful for detecting indications of a false breakout and reducing false signals. On trading platforms such as MT4 and MT5, traders can use alerts and notifications to get notified when the price breaks a certain level. There are built-in alerts for that purpose. However, simply searching for free Expert Advisors online can also be helpful as there are hundreds of free and paid indicators available including breakouts. A better method is to use built-in indicators like the ones mentioned above (MACD, RSI) and ATR. 

Using MACD and ATR for fakeout detection

When thinking about false breakout forex platforms provide built-in indicators that enable you to measure the momentum and volume behind every move, making it difficult for price to trick you into fakeouts. 

MACD histogram

A shrinking histogram that follows a breakout attempt could be a warning sign of waning volatility and a false breakout in trading. If the price extends beyond a recently broken level on a flattening histogram, the move often returns ending up in a fakeout and traders should be careful and not rush entries when such events occur. 

ATR

A contracting Average True Range before a breakout indicates low volatility. Valid breakouts typically have a strong volatility and high trading volume and this sign should warn traders that the move might be weak without significant trader support behind it. Since true breakouts follow volatility expansions, breakouts from low ATR conditions are more likely to fail. 

ADX 

ADX is perfect for confirming the trend strength. ADX readings below 20 typically indicate range or sideways markets where neither bulls nor bears are in control. Breakouts that happen when ADX is below this threshold have higher failure rates. Rising ADX which is above 25 after a break occurs can be a good indicator of a genuine breakout.

Start Trading in 10 Minutes

Apply everything you’ve learnt on a real trading account with up to 1:2000 leverage, negative balance protection and outstanding support.
Get Started

False breakout examples

Let’s discuss some of the fakeout examples to see how they occur in live markets. 
adx-fakeout.png

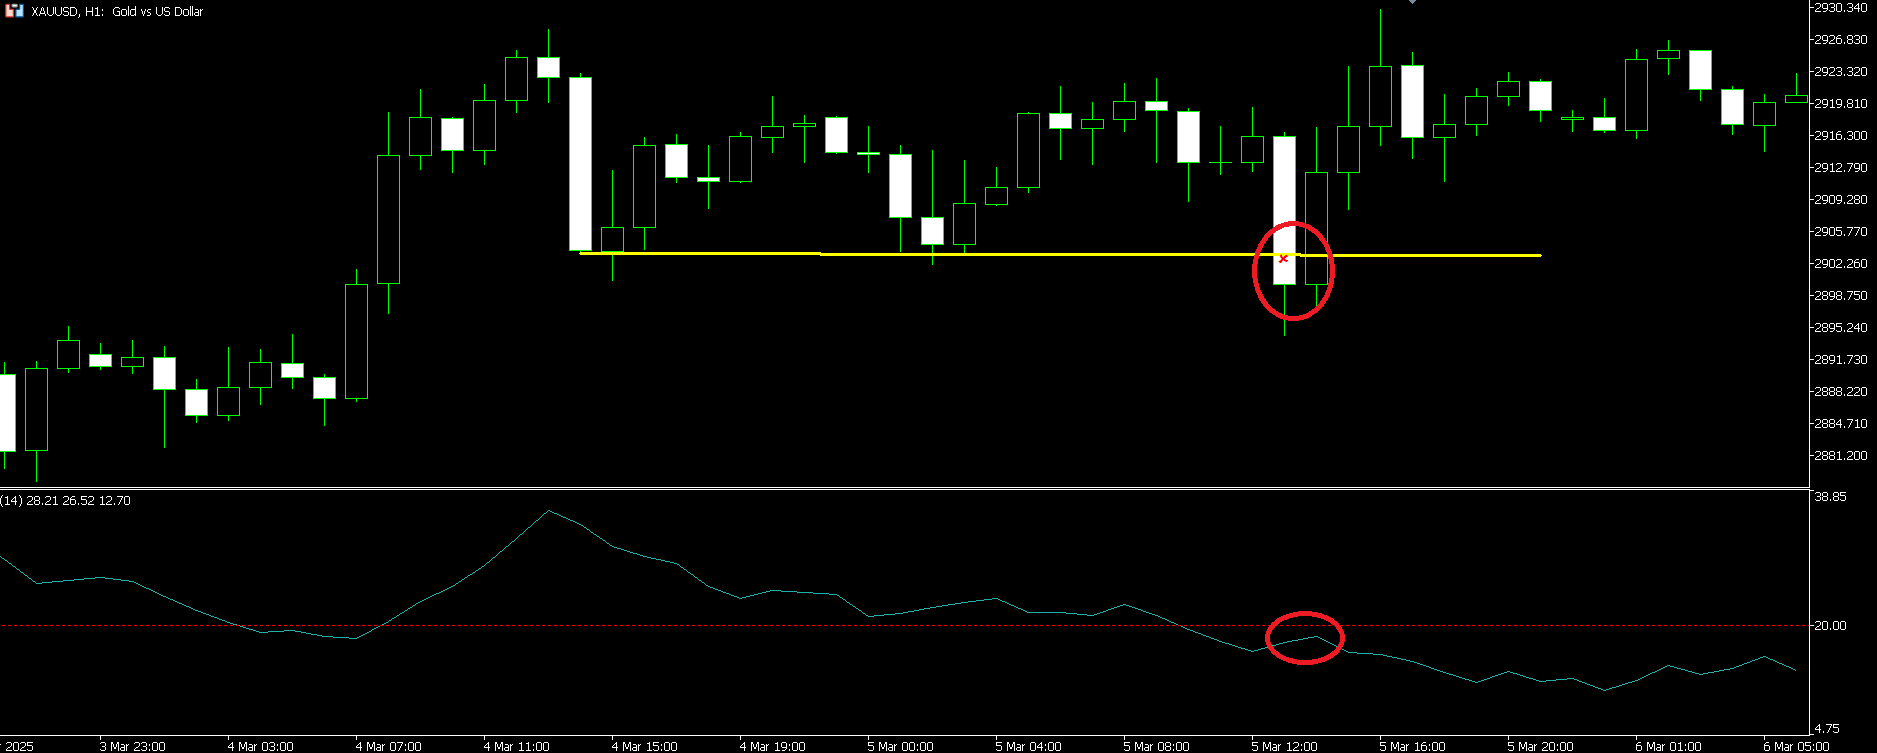
The first one is a fakeout that happened on Gold CFD in the 1-hour timeframe. The move was started by a huge bearish impulse that broke the level and closed below it. However, the ADX was below 20, indicating that there was not much momentum behind this move, which was confirmed later when the price reversed on the next candle, crossing the support zone and closing above it. This case is complicated as the price managed to close below the support which could trap many inexperienced traders to enter on the short side because of FOMO (fear of missing out). Experienced traders would notice that ADX and other indicators did not indicate much momentum.
macd-fakeout.png

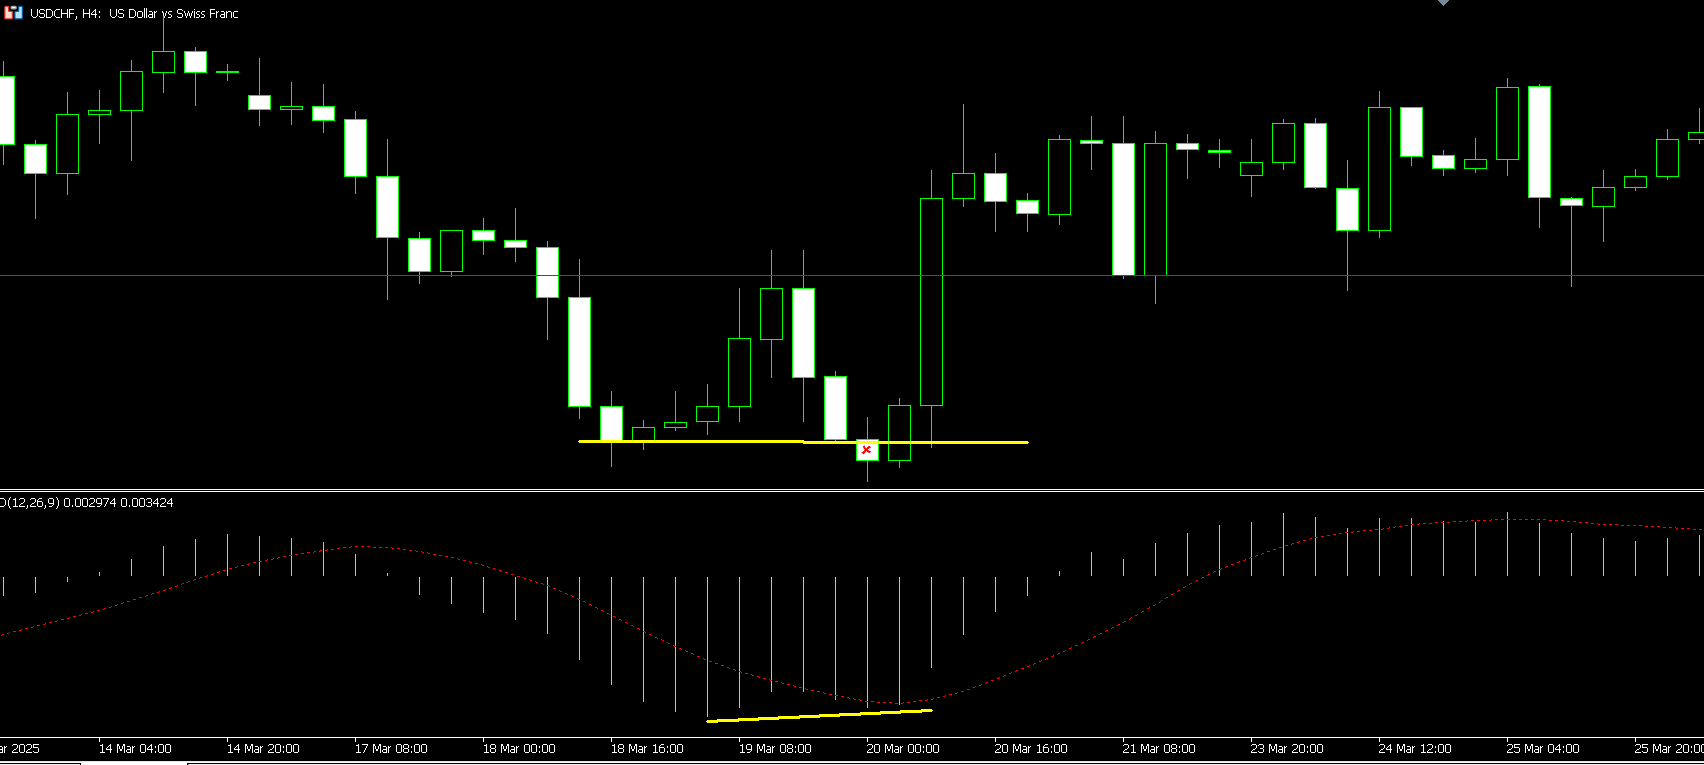
The next example occurred on a USD/CHF (U.S. Dollar against Swiss Franc) 4-hour chart where the price printed a bearish candle slightly below the lowest price (support zone). However, the MACD histogram showed that this price impulse was actually weaker than the previous impulse, indicating that this could be a fakeout. This was later confirmed by the price reversing upwards and moving all the way up to previous resistance levels.
btc-classical-fakeout-1.png

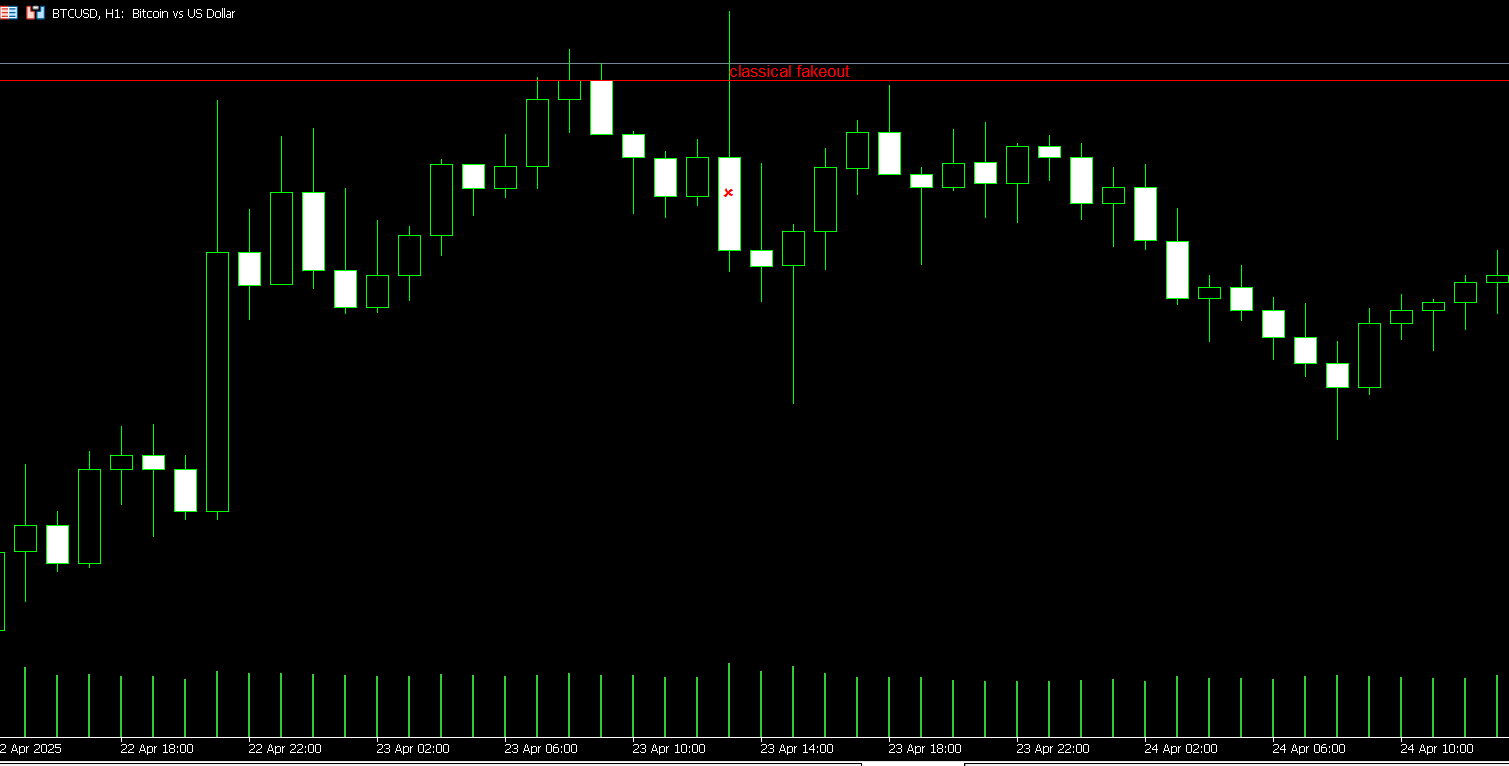
While the abovementioned fakeouts could only be detected via indicators such as MACD and ADX, the following one is a classical fakeout setup. The price on the 1-hour BTC/USD chart started to rise rapidly and it broke the resistance level without an issue only to immediately reverse and close below the resistance level. This is why traders should wait and see what the price does after breaking the zone. This setup is easier as it also shows no volume spike during the breakout, indicating that there were not enough buyers behind the move to support the price action with strong volume. 

How to trade and avoid fakeouts

Seeing a false breakout in trading might befrustrating for beginner traders, but there is a way to counter and use false breakouts to catch valid trades. One of the best methods is to wait for the price to break the level, then retest the level and only enter when it decides where to move.

The first step is to try not to enter right away when the breakout happens if it's not supported by an indicator and if it does not close beyond support and resistance levels. Waiting for several candle closes and retests remains the best approach where the trader avoids fakeouts and catches valid breakouts. Reducing fakeouts and waiting for the best setups at the pullback, enables seasoned breakout traders to reduce false signals and increase their win rate, which is important for reducing losses. 
retest-fakeout-trading.png

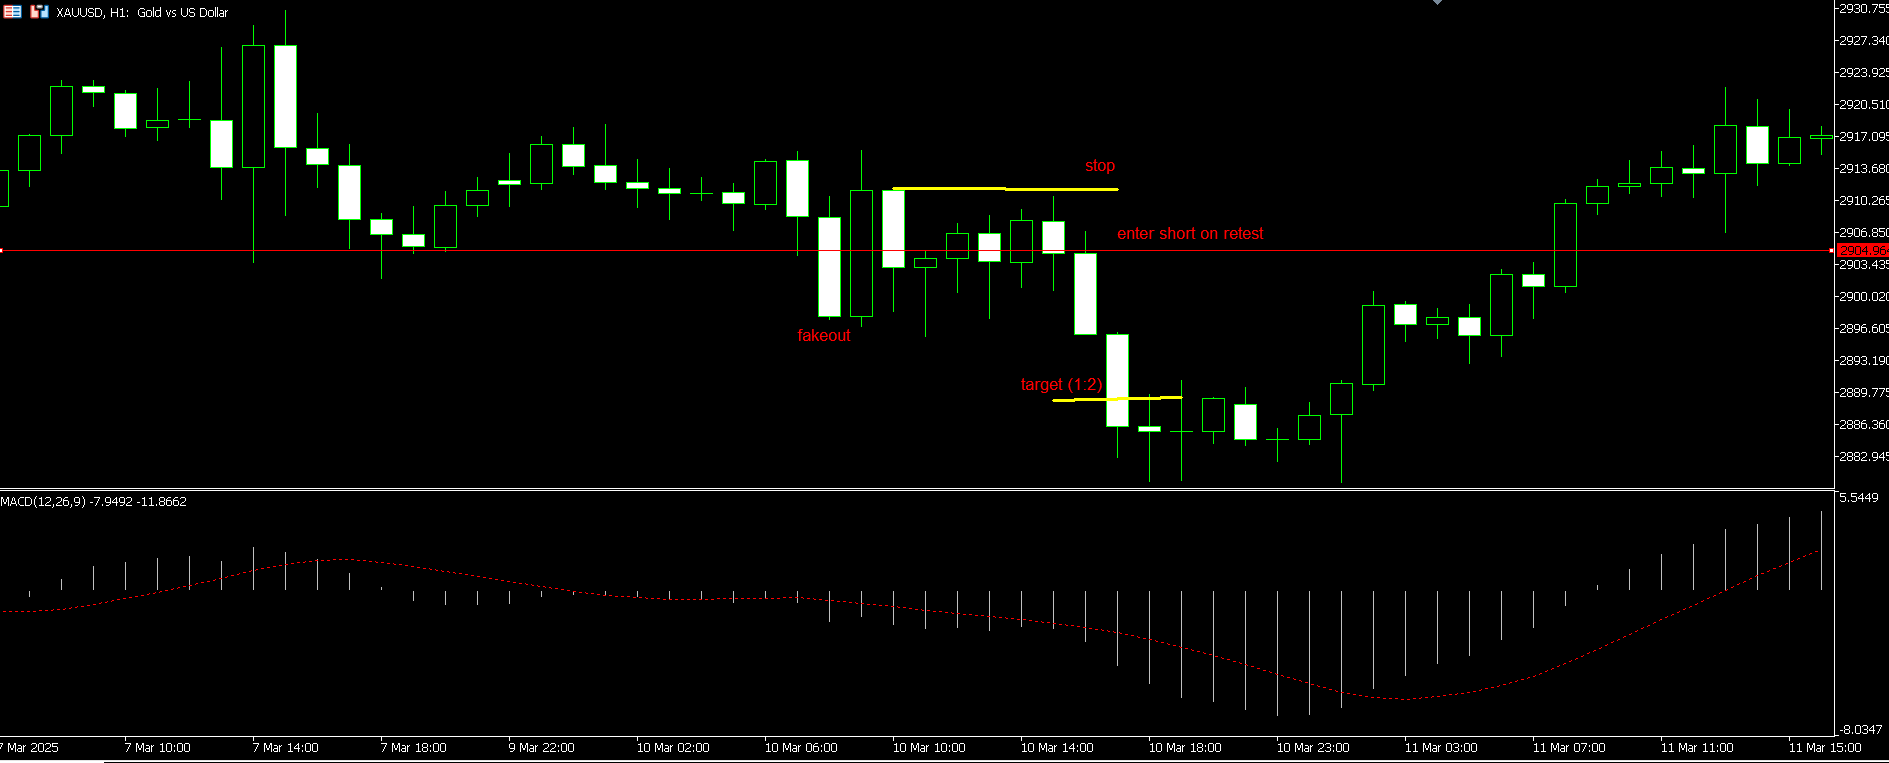
In the XAU/USD (gold) 1-hour chart, the price broke out of the level then it went back but started to move around the support zone and then continued in the direction of a breakout after retesting. Traders could enter after gold tested the support zone and it became a resistance level. As the price went down, traders would ride it for profits. 

Entering against breakout

Many traders also trade against breakouts and they target the midpoint of the prior range with a minimum 1:1 risk-reward ratio. Surely, having a higher risk-reward ratio such as 1:1.5 and beyond would make more profits but also more losing trades. This strategy enters when the breakout happens and the price fails to close beyond the support and resistance levels, capitalizing on fakeouts. A lower risk-reward ratio will mean a higher win rate, so, there is a tradeoff here. 

This strategy is effective when indications of a false breakout are clearly visible. Traders should try to trade only clean and well-tested levels where the price has bounced multiple times. Zones with more touches typically are more solid and fakeouts happen frequently. 

Risk management 

In our false breakout examples, traders would lose money. Even when traders use other tools for confirmation, fakeouts can still occur, meaning it is mandatory to use strict risk management strategies. 

The most important risk management tools are stop-loss and take-profit orders. The stop loss is crucial in Forex trading and traders should always set stop-loss to ensure the losses are cut early. There are many methods to set stop-loss like behind recent price swings or at a fixed distance from entry. 

Another important way to manage accounts and ensure long-term success is to have realistic expectations and goals. Traders should aim to stay in the trading game long-term and protect their capital by using stop-loss and take-profit orders. Position sizing and not risking more than 2-3% of your account on any single trade is another effective way to minimize risks and eliminate the risk of ruin. Even if your strategy hits the losing streak, by risking no more than 2-3% of your account, the losses will not be substantial. 

Trading journals and constant reviews of your trading performance will ensure you are always in control of your trading performance. Traders should write down all their trades and later analyze them for insights to find errors and what could be improved. 

Conclusion

False breakouts in Forex trading are frequent and occur when the price crosses the support and resistance level but fails to move forward and reverses. False breakouts or fakeouts are a serious challenge for breakout traders and by understanding their nature and meaning, it is possible to avoid fakeouts and minimize losses. Traders can spot fakeouts before they happen by analyzing volume and price action. Psychological drivers like FOMO coupled with low-liquidity spikes around news events, fuel fakeouts. Traders can distinguish fakeouts from true breakouts by analyzing price action: sustained closes beyond levels, rising volume, and momentum, typically indicate genuine breakouts while low volume usually indicates fakeouts. MACD, ADX, and RSI indicators can be deployed to analyze trader power behind breakouts and get early signs of fakeouts. Effective strategies include waiting for retests or trading against breakouts with a lower risk-reward ratio to achieve high win rates. Strict risk management using stop-loss and take-profit rates and journaling and analyzing all trades also contribute to successful fakeout trading. 

 
Axiory uses cookies to improve your browsing experience. You can click Accept or continue browsing to consent to cookies usage. Please read our Cookie Policy to learn more.