The best MT4 indicators to trade FX
There are lots of different Forex MT4 indicators that traders use to analyze the market movements and speculate future prices of their assets. These indicators can be categorized into different groups, including volumes, oscillators, trends, etc. and all of them are used for one purpose: technical analysis.
In this article, we have decided to take specific technical indicators that are available on MT4 and describe their functionality, as well as how you can enable them in the chart. So, here are the top three indicators of our choice:
- Moving Average Convergence/Divergence (MACD)
- Stochastic oscillator
- Bulls/Bears power
These indicators are similar in one major way: all of them analyze the already-occurred price trends and try to give out signals as to when a trader should buy or sell an asset. Although, the way they do that and also their additional benefits are pretty different from one another. So, let’s take a look at each of these indicators.
How to enable these best MT4 indicators free?
Another similarity between these indicators is that traders don’t need to pay anything to enable them in their software. Usually, all three of these indicators are included in the stock platform, but if they aren’t, it’s pretty easy to
download them for free.
There are many online platforms where the best MT4 indicators free download is available and where one can find the MACD, Stochastic, and Bulls/Bears power indicators pretty easily. Once the installation file is downloaded, a user should extract it in the MT4 source folder: go to the corresponding department of your disk drive, open the MT4 folder, then double click on “MQL4” and paste the MACD files in the “Indicators” folder.
After restarting MT4, these indicators will be available in the Navigation panel in the left side of the panel. In order to plot MACD into the chart, you need to go to the Insert menu at the top-left corner, choose Indicators, come down to Oscillators, and select MACD. In fact, the rest of the two indicators - Stochastic and Bulls/Bears power - can also be enabled from the same menu.
Now, while these and many other important indicators are free, it doesn’t mean that all of them are like that. There’s also plenty of best paid MT4 indicators to be found on the internet, however, it may not be as reasonable for the beginners to buy them - they’re usually quite complex which is why they are paid in the first place.
Trading with these indicators in real life
After installing these three indicators in MT4, now it is time to actually use them in trading. Let’s see what each of them does in Forex, as well as other markets.
The MACD
The Moving Average Convergence/Divergence is a technical indicator used for detecting the momentum of the historical trend. It represents the relationship between the two average prices in order to give traders a better understanding of the price movements.

The MACD line is the first incremental element of this indicator. It derives from subtracting the 26-day Exponential Moving Average (EMA) from the 13-day EMA. The difference between the shorter EMA and longer EMA shows how big/small the recent price changes are. Alongside the MACD line, we also need to plot a 9-day EMA on the chart, which will act as a signal line.
So, as noted earlier, the MACD is among the best MT4 indicators for binary options, Forex, stocks, and other securities because it easily shows how quickly the prices are changing. Besides, the indicator gives out signals for when it is the best time to buy or sell the asset.
There are many ways of interpreting the data on the MACD window in the chart. The most popular and simplest one is called “Crossovers,” and as the name suggests, it gives out signals when the MACD line crosses above or below the signal line: if it’s above, then the indicator gives out a buy signal; if it’s below, a trader will get a sell signal.
There are also other interpretation methods like “Dramatic Rise/Fall,” when the MACD rises or falls very drastically and the indicator gives out the opposite signal: if the MACD rises, it shows that the market is overbought and the price is expected to decline, therefore the sell signal is output; conversely, when the MACD falls, the market is oversold and the price is expected to rise again, therefore the traders will get a buy signal.
Stochastic oscillator
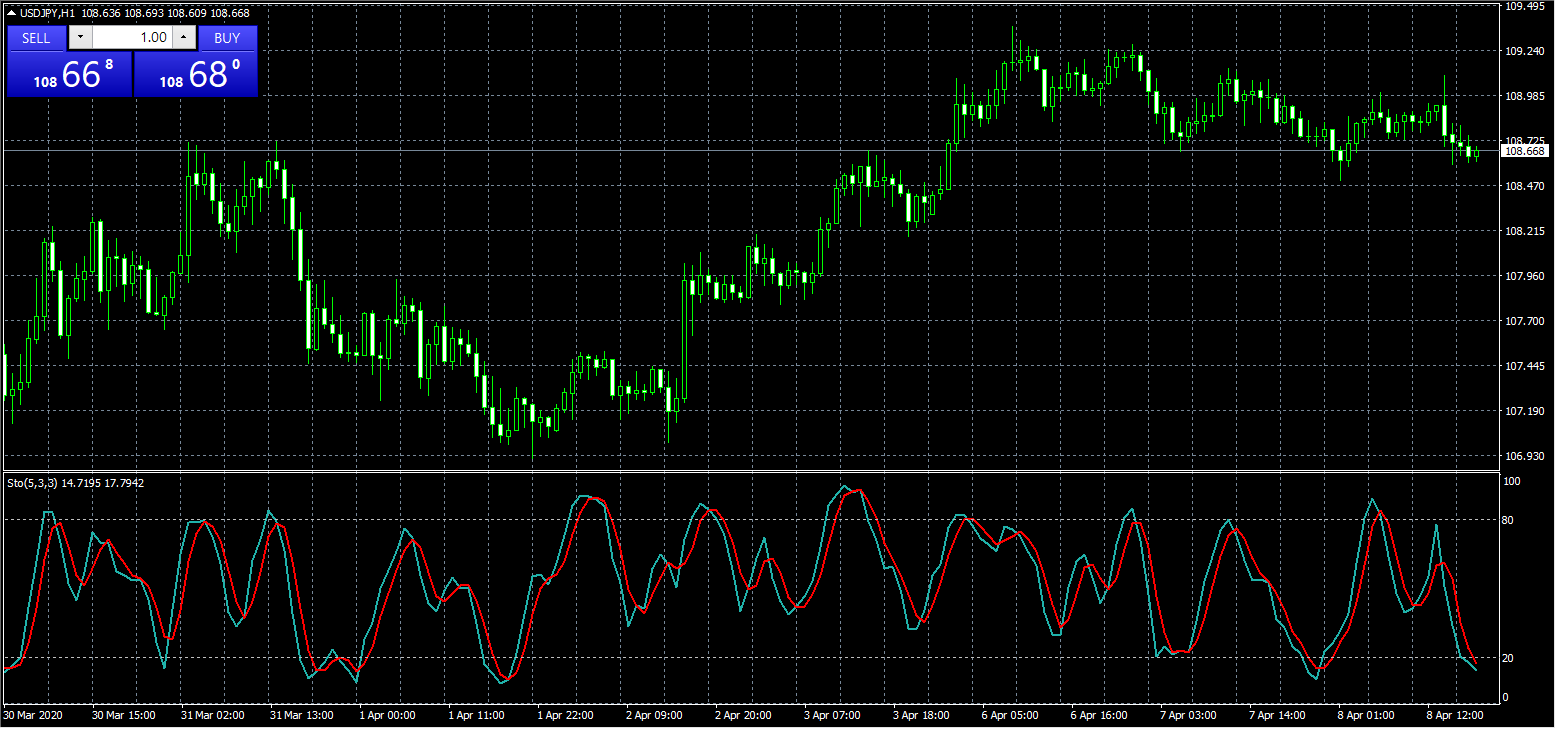
Coming up, let’s talk about the Stochastic oscillator, which is also an indicator that serves to detect the momentum of the trend, but it’s not one of the best MT4 indicators the 2020 Forex market has for this reason. The indicator enables traders to predict where the current trend will ultimately end up.

The Stochastic uses a scale from 0 to 100 to measure the rate at which the price has changed from the previous closing price of an asset. The scale is then applied to the Stochastic lines to determine if the market is overbought or oversold.
If the Stochastic lines are above 80, the indicator shows that the market is overbought, and according to the supply-demand law, the price has to go down in order for the market balance to restore. Therefore, the traders get the sell signal.
Conversely, if the Stochastic lines are below 20, the indicator shows that the market is oversold, and the same economic law suggests that the price should increase to restore the balance. That’s why the indicator will give out the buy signal.
There is the third option, where the Stochastic lines are in between the two checkpoints. Here, the Stochastic oscillator uses the following theory:
- During the uptrend, the prices will likely remain above or at least equal to the previous closing price of the asset;
- During the downtrend, the prices will likely remain lower or equal to the previous closing prices of the asset.
And this theory tends to describe the price movements accurately, at least in most of the cases. When looking at the Stochastic window in the chart, the lines in-between the 20 and 80 checkpoints are usually going in their previous direction, and when they reach those checkpoints, they tend to take the opposite direction.
Bulls/Bears powers
Finally, let’s talk about the
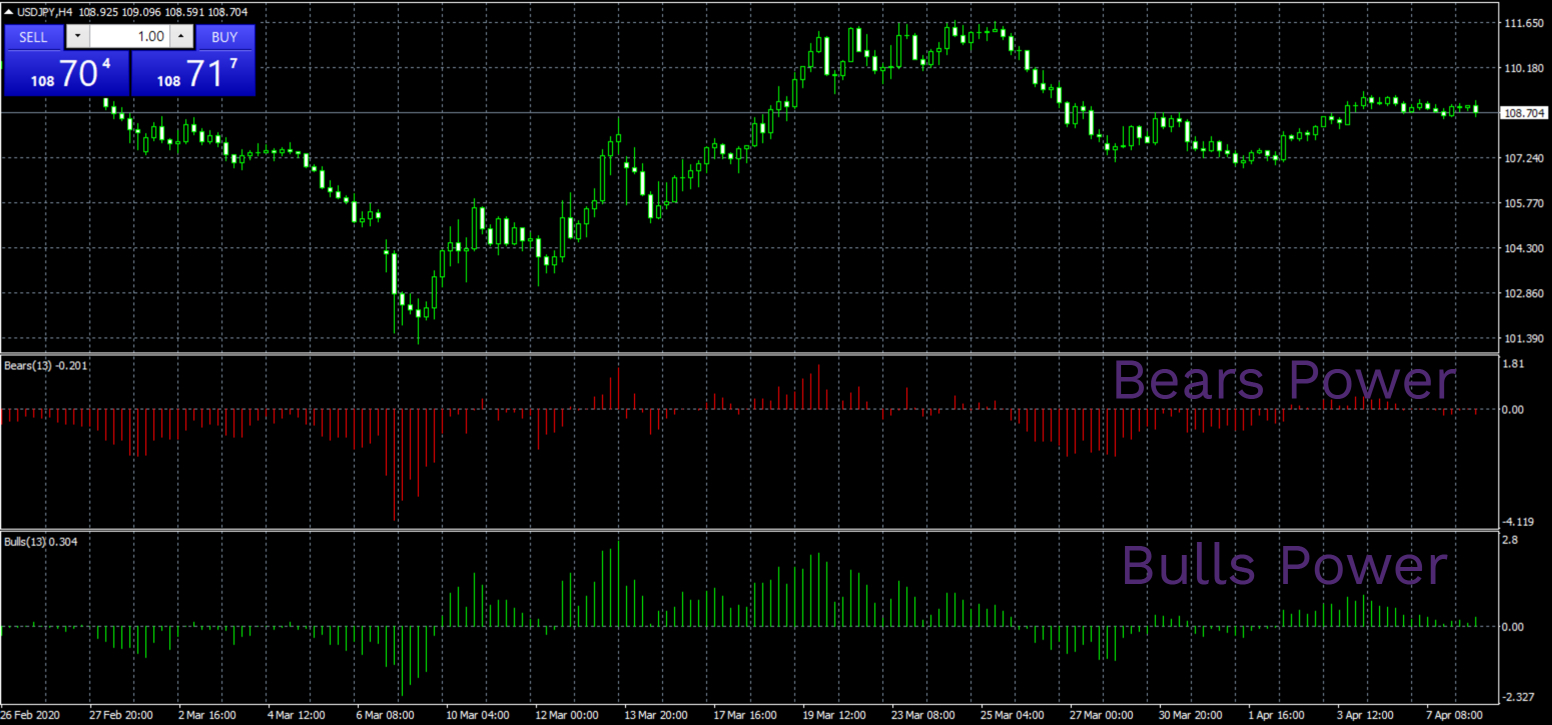
Bulls and Bears powers - the best Indicators available in MT4 for assessing the strengths of market participants. These indicators measure how beneficial the market conditions are for buyers and sellers.

The Bulls power shows if the buyers’ interests are strong on the market, that is, whether the price of an asset is increasing or not. The Bears power shows how strong the sellers’ interests are on the market - whether the prices are decreasing or not.
The Bulls/Bears power MetaTrader indicators also use the 13-day EMA as a signal line for receiving specific signals within the trade. There are two requirements for each indicator to meet in order to get a buy/sell signal. For the Bulls power to give out a buy signal:
- The EMA should be in an uptrend (increasing)
- The Bears Power should be negative but increasing as well
For the Bears power to give out a sell signal:
- They should be in a downtrend (decreasing)
- The Bulls Power should be positive but decreasing as well
Here are some newest indicators for MT4 that traders liked and are 100% free:
PR Support And Resistance for MT4

PR or price action support and resistance indicator is pretty straightforward: it draws support and resistance lines on swing highs and lows for a user-specified period. In the settings, traders can select their preferred period to draw lines and make it easier to see how the price is behaving.
Use cases: Support and resistance are widely used by day traders to not only catch important price swings but also use them to stop loss and take profit targets. Knowing the zones where prices might struggle gives traders an advantage to place their targets close to these levels.
Where to find: It can be downloaded from the official website of MT4 store and is absolutely free which makes it a very useful tool.
Support and Resistance by MACD

Everyone loves MACD. It offers valuable insights into price dynamics and is used widely by day traders and scalpers. Support and Resistance by MACD is an indicator developed for MT4 that uses MACD to detect support and resistance zones in the market. Detecting key levels on the cheat where price might experience serious struggles and even reverse can be super valuable for traders.
Use cases: The indicator can be used to detect important zones based on MACD and use this knowledge to anticipate price reversals and breakouts in the market.
Where to find: The indicator is free and available on the official web store of the MT4.
SX Currency Strength MT4

Warning! This indicator might seriously increase your win rate, as it displays a small window below the chart depicting the strength of five major currencies. These currencies are USD, EUR, GBP, JPY, and AUD across selected timeframes. It has intuitive visuals and offers deep insight into each currency's strength by plotting each of them as a line with different colors. Applying SX currency strength to the chart you are trading can offer result-changing information.
Use cases: SX Currency Strength can act as a powerful filter to see how strong the asset you are trading is relative to major currencies.
Where to find it: You can download it for 100% free from the official MT4 web store of indicators. The process will take a few seconds if you have the MT4 platform already installed on your machine.