The Basics of the Fibonacci Ratios
Before we switch to the errors when using Fibonacci retracements, let’s first briefly explain what the tool is and explain its underlying principles.
Fibonacci retracements are a tool that is built inside most modern trading platforms like cTrader, MetaTrader 4 & 5. It is derived from the famous Fibonacci sequence, which is a series of numbers where every next number is the sum of the two preceding ones (0,1,1,2,3,5,8,13, etc.). In trading, no matter the markets, key ratios used include 23.6%, 38.2%, 50%, 61.8%, and 78.6%, and they are used to mark potential support and resistance levels. Traders use the Fibonacci retracement tool to pick significant swing lows and highs, and the tool then shows potential reversal levels (the percentages of the move between the swing high and low where the tool is applied).
How to use Fibonacci retracement in MT4
MT4 and MT5 have almost the same Fibonacci Retracement tool. Traders can just click on the tool on the top menu panel and then select the lowest swing and the highest price swings. For buy trades, traders need to place the tool from low to high to identify support in an uptrend, and for sell trades, traders need to place it from high to low to detect possible resistance levels.
Here is a step-by-step guide to using the Fibonacci retracement tool:
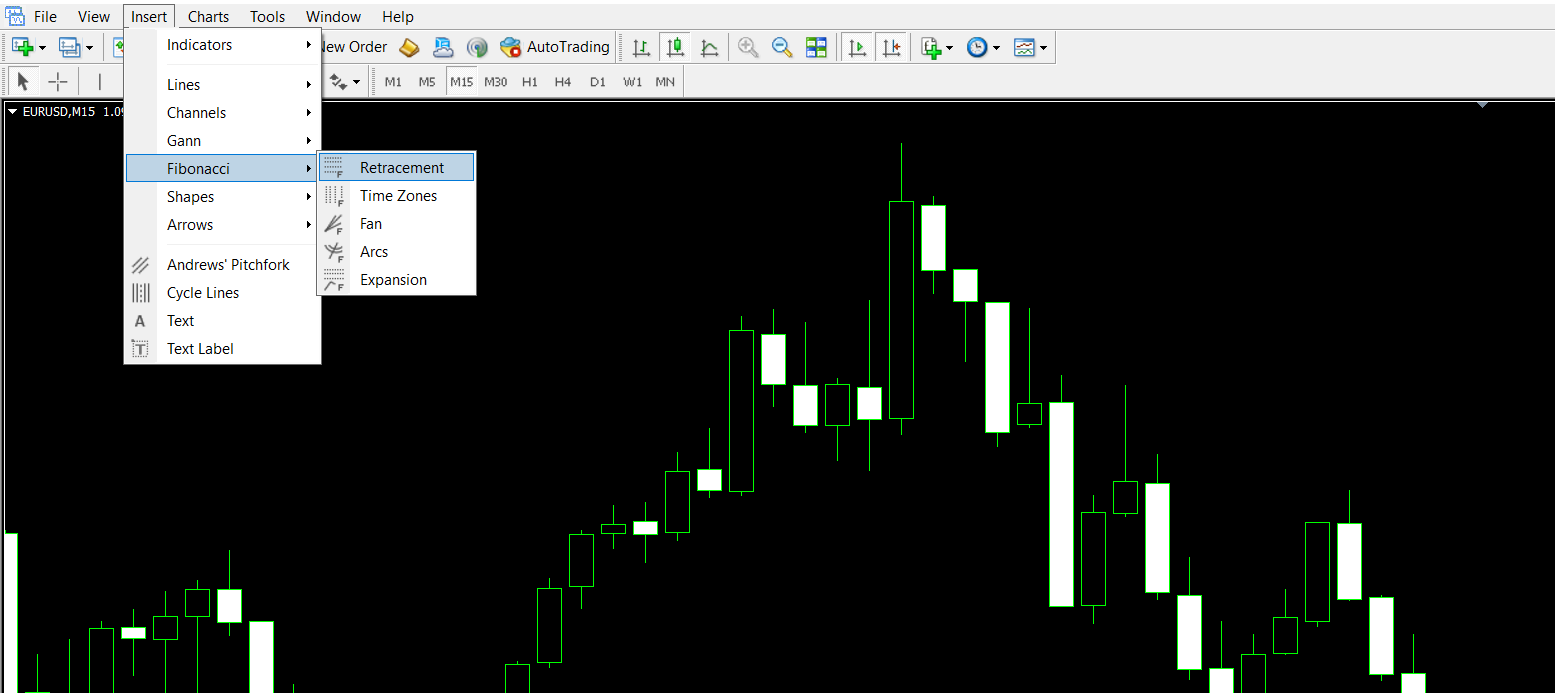
Step 1. Select the tool from Insert → Fibonacci → Retracement, or click directly on the top menu Fibonacci tool

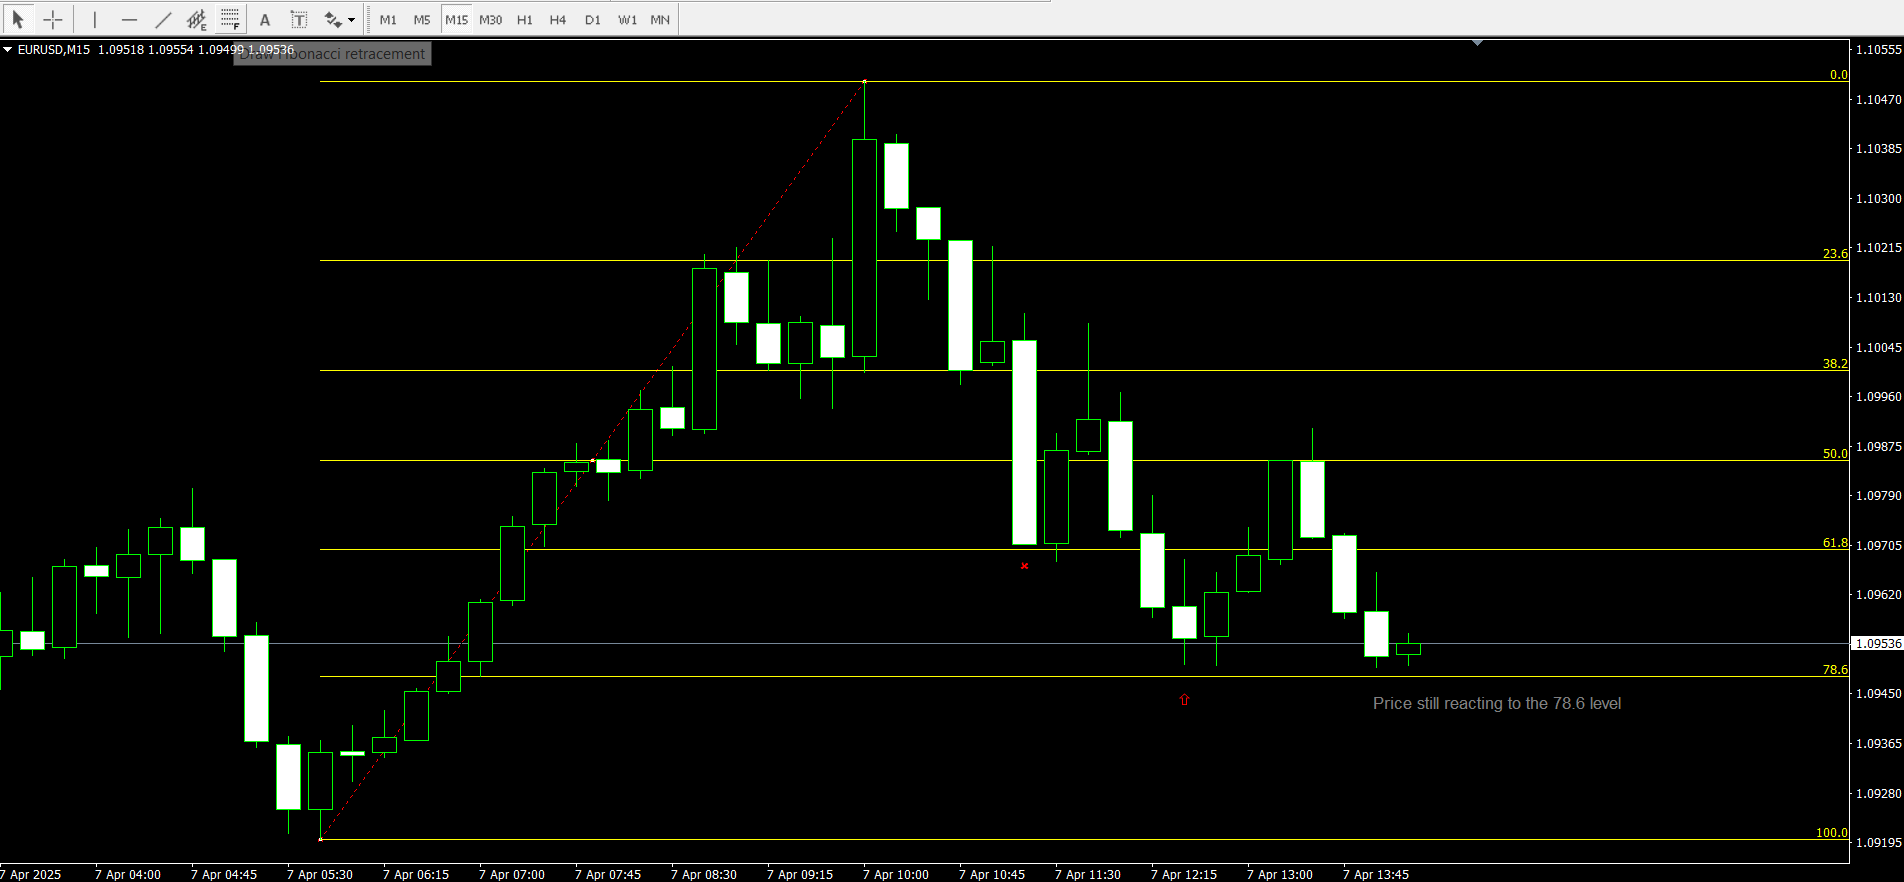
Step 2. Depending on the latest price swing, apply it from low to high or vice versa (when uptrend, you need to apply it from low to high and high to low when bearish trend.

The tool is really powerful and the price often respects its levels. If we observe the above picture closely, the price retraced from 61.8 slightly but broke it and reversed from the 78.6 level and making it a support zone. In this case, since it was an uptrend, we applied the tool from the bottom of the price swing to the top, covering the one price swing from start to finish. The most famous Fibonacci ratio is 61.8%, which is often called the golden retracement. This level is thought to be the most critical of the Fibonacci levels, and price often reverses on this exact level. However, in our example, the market went further and broke the level to create a strong support zone at 78.6%.
Let’s now switch to our main topic and discuss what the most common Fibonacci retracement trading errors are and how to avoid them.
Common Errors When Using Fibonacci Retracements
Even with the right tool in hand, errors in its application are very common with the Fibonacci tool. Many traders often make mistakes in selecting the swing points, which are the foundations of Fibonacci retracement analysis. Mistakenly drawing the tool leads to incorrect results, and trading performance suffers. Among the common Fibonacci retracement mistakes is when traders misidentify the points or switch between different methods (using the candle’s body in one instance and the body in another). The resulting retracement levels will be off, trading decisions will lose accuracy. It is therefore critical to develop a consistent approach to drawing these lines.
Inconsistent reference points: A major trading error?
Another big mistake traders make is using inconsistent reference points. Imagine drawing a Fibonacci retracement from the candle’s high in one analysis and then from its close in another. Inconsistency is the biggest enemy of a trader, and it can shift the Fibonacci levels significantly. The support and resistance levels may fall at prices that are not supported by the broader market context, which is never a good thing in trading. The solution here is to decide whether you are using extreme price points of the candle (the wicks) and stick with that method for all your analysis. You could also use candle wicks for these points, but you have to stay consistent with your chase method for all analysis. Consistency builds reliability in your trading and Fibonacci levels.
Ignoring market context and long-term trends
Common errors in Fibonacci trading also include errors in applying Fibonacci retracements in isolation and using them as a standalone indicator, especially on short-term charts, disregarding the larger market picture. Short-term charts (lower timeframes) are noisy, and recent levels drawn on these timeframes are not as reliable as those taken from longer-term trends. To make Fibonacci retracement more effective, traders should use it on 1-hour and above time frames. If you are trading on a 5-minute timeframe and the market becomes volatile, Fibonacci levels might produce false signals. So, the solution is to use higher timeframes to spot strong levels and then use shorter timeframes for finding the best entries. In fact, experienced traders who trade using Fibonacci levels trade using this method.
Another important aspect of technical analysis is to always combine several tools for confirmation. In this case, together with Fibonacci levels, it is possible to employ other technical indicators such as the MACD, RSI, moving averages, or even simple candlestick patterns. This can enhance reliability and signal accuracy in your Forex trading decisions.
Common Mistakes While Trading Fibonacci: The Dos and Don'ts in Forex
Let’s now dive deeper into the practical implications of common Fibonacci retracement mistakes. One frequent error is to use the Fibonacci tool in extremely volatile markets. In fast-moving markets caused by major news announcements or geopolitical shifts, the retracement levels can shift so quickly that chasing them might cause losing streaks. Major news announcements are risky as they cause major volatility in markets, making it impossible to identify support and resistance levels in mere seconds. As the Fibonacci retracement is a manual tool, traders should avoid trading with it during major news events such as employment rates (NFP), interest rates, inflation, and so on.
Another don’t is: never trade with any single indicator or tool. Only relying on Fibonacci retracements is a bad idea, and traders should combine it with other tools and indicators.
Identifying Fibonacci Retracement Mistakes: How to Get Better
When trying to improve your Fibonacci skills, it is essential to first be aware of your mistakes and shortcomings. The key here is to start a trading journal where you record every trade or trading analysis that involves Fibonacci retracements. Apart from doing a trading journal, it is a well-adopted method to ask yourself several questions. So, what are the mistakes when using Fibonacci retracements?
- Did I use the same method (e.g., candle wick or body) for all swing points?
- Are rat recruitment levels aligning with the long-term trend?
- Do other indicators also confirm the potential reversals at Fibonacci levels?
- Am I constantly adjusting my levels as the price changes?
Your trading journal should answer all these questions, so ensure you write down all important data about your analysis, such as where you put Fibonacci levels, what the reading of confirmation indicators was, what the major long-term trend was, and so on.
Self-assessment is key in financial trading as it mainly involves psychological factors apart from technical skills and market knowledge.