What Is MACD and How Can It Help Your Trading?

Technical analysis involves using tools such as technical indicators to make sense of financial market movements and capitalize on opportunities. One of the most popular technical indicators is the MACD, which is widely popular among beginner traders. In this guide, we will focus on the Moving Average Convergence Divergence (MACD), which is a very versatile indicator and can be a nice addition to your trading arsenal when used correctly, as given in this guide. We will explain what is MACD in forex and how it simplifies complex market data into clear trading signals, which makes it much easier for traders to spot trends, momentum shifts, and potential reversal points on the price chart.

Start Trading in 10 Minutes

Apply everything you’ve learnt on a real trading account with up to 1:2000 leverage, negative balance protection and outstanding support.
Get Started

What Is MACD Indicator?

The moving average convergence divergence indicator is a popular technical indicator that is mainly used to gauge both trend direction and momentum in Forex and other financial markets. It was developed in the 1970s by Gerald Appel and quickly gained traction among traders for its simplicity and effectiveness. The MACD can signal potential market reversals and trend continuations. 

MACD indicator origin 

At its core, the MACD compares two moving averages, a shorter-term EMA (exponential moving average) and a longer-term EMA, to generate a momentum oscillator. It is mainly used by FX traders to visualize and qualify shifts in market momentum and trend strength. It is super useful to simplify complex price action into manageable signals.

Core components: how the MACD indicator works

The indicator consists of three main components:

  • MACD Line - This line is calculated by subtracting the longer-term EMA (26-day EMA by default) from the shorter-term EMA (12-day EMA by default). This formula shows the difference between short-term and long-term price movements.
  • Signal Line - A 9-day EMA of MACD line is the signal line and is mainly used as a potential buy and sell signal.
  • Histogram - Histogram represents the difference between the MACD oscillator line and the signal line. It visually shows the strength of the momentum. A histogram is given with bars, and when these bars are above zero, they indicate bullish momentum, and bearish momentum when they are below zero. 

MACD on MT4 and MT5 platforms

MACD-main-and-signal-explained.png
When it comes to trading platforms such as MetaTrader 4 and MetaTrader 5, the MACD calculation is the same as with other platforms, but these platforms only show the main histogram and signal line. So, the signal line and the main histogram crossovers can be used as signals. Generally, the histogram is very useful to detect where the price is moving at the current moment. When the histogram is below zero and expands, it is a good indication of a bearish market, and the opposite is true when it is above the zero line. The signal line is generally used for signals, but some traders might ignore the line and only use the histogram as a general direction filter. When it comes to TradingView, for example, the MACD indicator is shown with a histogram and signal line plus the main line, which might be more visually appealing.
macd-in-tradingview.png

This way, traders might use crossovers for signal generation and histogram versus price position as a directional filter. It all depends on the trader’s preferences and the markets where it is used. 

Convergence and divergence meaning in MACD

The terms convergence and divergence might be confusing for beginners and make the indicator seem like a complex tool accessible only to pros. However, their meaning is rather simple:

  • Convergence - When the moving averages come close together, it suggests the momentum of the current trend may be waning. 
  • Divergence - When the moving averages move apart, it suggests the trend is strengthening or the potential reversal could be on the horizon, giving traders hints about possible entries. 

Many traders use moving average crossovers as signals for trading, but as with any indicator in financial trading, it is necessary to combine the MACD with other tools for more precise entries. 

MACD calculation and the best MACD parameters

The three components of the MACD indicator are calculated as follows:

  • Determine the EMAs - First, we need to calculate the 12-period exponential moving average and the 26-period exponential moving average on the asset’s closing (default) prices. Modern platforms allow traders to select if the MACD is calculated on closing, opening, High, and Low prices, which gives traders greater flexibility.
  • Computing the MACD line - Subtract the 26-period EMA from the 12-period EMA

MACD = EMA(12) - EMA(26)

  • Calculating the signal line - The signal line is a 9-period EMA of the MACD line. This signal line smooths out short-term fluctuations and is used to trigger trading signals.
  • Interpreting the histogram - The histogram is the backbone of the MACD indicator. It is the difference between the MACD line and the signal line and provides visual evidence for the momentum strength. A growing histogram indicates strengthening momentum and a shrinking histogram suggests fading momentum. 

Example:

Let’s consider an example of a EUR/USD FX pair. Assume the EUR/USD pair has a 12-period EMA of 1.1500 and a 26-period EMA of 1.1450. The MACD line would be calculated as:

  • MACD = 1.1500 - 1.1450 = 0.0050

If the 9-period EMA (signal line) of the MACD is calculated at 0.0040, the MACD line crossing above the signal line wold indicate a bullish momentum. This could be a good opportunity to consider a long position on the EUR/USD pair if other indicators also indicate bullish momentum. 

The best MACD parameters

The best MACD parameters depend on many things, such as the timeframe and the trader’s preferences. Default parameters are pretty useful, but traders can adjust their MACD to their trading needs. If a trader wants the MACD to be more responsive to current price changes, they might enter lower numbers. However, there will be more false signals as well, together with good signals. If a trader uses bigger numbers beyond the default parameters, then signals will be rarer, but lots of noise will be eliminated in the process. 

For beginners, it is best to leave the default settings untouched and try to learn and master the MACD and how it responds to different markets. For traders who have more experience, it is possible to tweak settings and backtest for developing new strategies. 

Start Trading in 10 Minutes

Apply everything you’ve learnt on a real trading account with up to 1:2000 leverage, negative balance protection and outstanding support.
Get Started

MACD in Forex Trading

Forex trading involves speculating on currency pairs, and traders often opt for technical indicators for technical analysis, and one of the most popular indicators is MACD. The FX market is the largest financial markets and it is even more imrpotant to know how to use MACD on currency pairs. Unlike stock markets, the FX market is not centralized, and trading occurs globally via electronic networks. 

Relevance of MACD forex

The MACD indicator is very useful in every market, including Forex currencies. The indicator can be used in both trending and sideways markets, which makes it powerful in FX, as it is known for being mostly sideways markets. Forex markets are trending only about 30% of the time. When markets are highly volatile, traders need tools that can quickly identify shifts in momentum and alert them to potential reversals or continuations. MACD compares different EMAs of the currency pair’s price and indicates changes that might not be immediately obvious in the candlestick charts. The indicator can simplify complex market movements in clear, actionable signals. In forex, just like in other markets, when the MACD line crosses above or below the signal line, traders can use this moment and, if other indicators confirm the signal, take a buy or sell trade. Divergences between the MACD and price action are also powerful signals of the weakening of a trend before it becomes obvious in the price chart, and it is often used as a powerful signal by traders. 

How to Configure MACD for Effective Trading

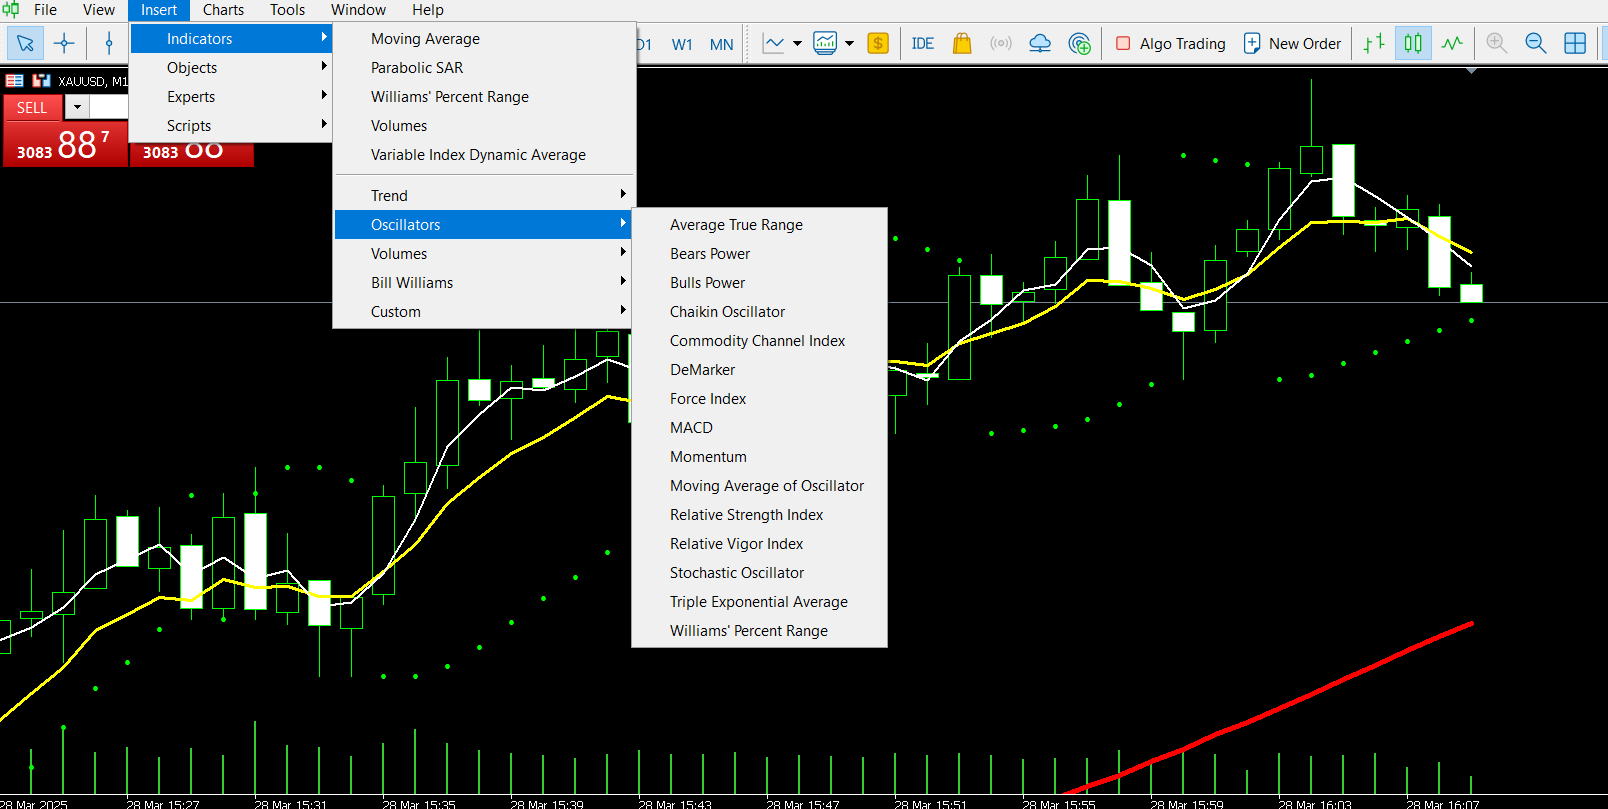
Configuring the MACD is important for time entries using its signals. The first thing to do is to add the MACD indicator to your price chart. You can do this by accessing the indicators menu and searching for the MACD indicator in oscillators. In MT4 and MT5, MACD is located in: Insert → Indicators → Oscillators → MACD. 
ADD-MACD.png

It is very easy to find and when clicking on MACD, traders can edit settings to their preferred values and also adjust colors for each of the lines and the histogram. TradingView also has MACD built-in just like all other modern platforms, and traders can easily add it to their charts. Standard MACD settings work the best on high timeframes like 4 hours and daily. However, while these settings are useful, traders can always adjust them to their needs and trading styles. 

How to configure MACD

Default settings include a 12-period EMA for the fast line, a 26-period EMA for the slow line, and a 9-period EMA for the signal line. These values can be customized according to the trader’s strategy. So, what are the best MACD parameters? Default settings are popular because they strike a balance between the sensitivity of the indicator and market noise, which is useful for mid-term or general FX trading. When employing scalping or short-term strategies, traders might reduce these settings to 6,13,5 for example, making the MACD react faster to small price changes. For long-term strategies, traders might use settings with higher periods, which will smooth out minor price changes and help better identify longer-term trends. Higher periods also reduce market noise. 

It is a good idea to adjust the MACD to a specific market and its conditions. For example, while EURUSD is mostly in a sideways market, Gold tends to trend more, and the same settings of the MACD might be useless in Gold trading. The best approach is to backtest and check on a demo account. 

Advanced insights into the MACD indicator how it works

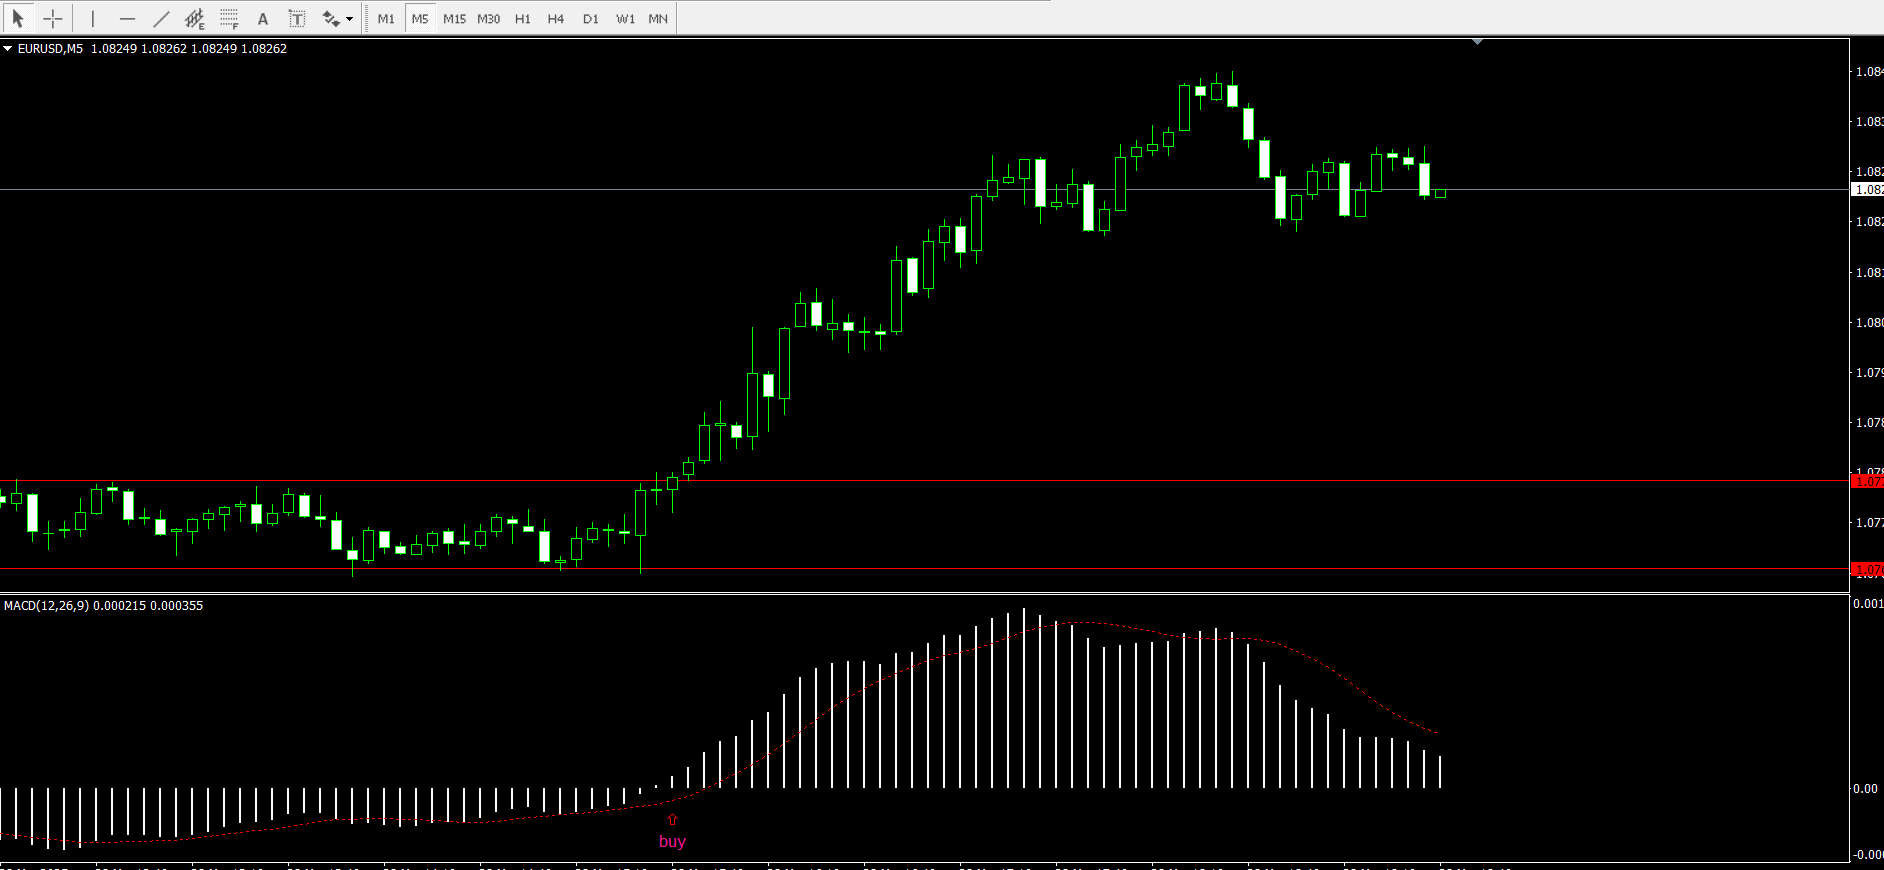
Trading Forex currency pairs using the standard MACD settings (12,26,9) is a simple process. The best MACD parameters are the ones that allow traders to see breakouts and reversals in time. When the price is moving slowly sideways and forms a channel, traders should be alert. When the MACD signal line crosses the histogram above and the price breaks out of the formed channel, and the candle closes above the channel, it might be a perfect time for entering a long position. Traders can also use smaller periods to make the MACD more responsive to small price changes on smaller timeframes like 1-minute and 5-minute. However, more noise and false signals will be produced, which increases the risk of losing money. 
advanced-insights.png

Risk management when using MACD

When using MACD or any other indicator in trading, it is critical to combine it with a sound risk management approach. Traders should always use stop-loss orders and place stops behind crucial levels. One such scenario is to place a stop-loss order behind the price swing that occurred during the MACD and signal line crossover. 

When it comes to take profit orders, it depends on the trading strategy, as some MACD strategies might employ trailing stops where take profit orders are not necessary. However, by using take-profit orders, traders can better manage their risk-reward ratio and win rates. 

Conclusion 

Combining everything we have learned so far, the MACD indicator is a must-have tool in FX trading. Traders should master the tool to better understand market movements and dissect complex price action into manageable chunks. MACD can provide a practical edge in trading by producing powerful signals, and traders can clearly see where the price is going and capitalize on these opportunities. When the signal line crosses the histogram, traders should be very alert, and if price action also confirms the crossover, then it might be a good reason for entry. When it comes to the best settings of MACD, beginners should first master the default settings and only then start tweaking the settings and backtest them thoroughly. However, no indicator is foolproof, and combining MACD with sound risk management and other indicators can help for better timing the entries and exits. 

Axiory uses cookies to improve your browsing experience. You can click Accept or continue browsing to consent to cookies usage. Please read our Cookie Policy to learn more.