How to use RSI - The best RSI Settings for Different Trading Styles
Depending on the trading style and trader preferences, RSI can provide valuable information and enhance profitability. Some traders might prefer the thrill of scalping, while others choose to follow trends or large price swings (swing trading).
RSI for day trading
Day trading means all trading positions are opened and closed within one trading day. It might include diverse trading styles like following intraday trends, swing trading, and so on. However, most often traders who are day traders will employ scalping methods to quickly open and close trading positions.
The best day trading RSI settings include:
- Set the threshold to 80/20 to avoid false signals
- Combine RSI with volume spikes to confirm entries
This way, traders ensure there are fewer false signals and can confirm if overbought and oversold levels are also supported by volume.
Scalping
Scalping is focused on 1-minute and 5-minute timeframes to catch tiny price movements and quickly open and close trades with tiny gains. Scalping strategies require the lowest spreads to ensure spreads and commissions do not eat all the profits. The best RSI settings for scalping strategies include:
- Use a 1-minute charts
- Use 14-period RSI to get fewer false signals
- Set thresholds to 25/75 to get early entries
When scalping, it is important to quickly close trades and avoid being in an open position for long periods.
Swing trading
Swing trading focuses on caching price swings both up and down and often includes strategies with win rates of 1:2. Swing traders need to combine RSI with other indicators like Moving Averages to filter buy and sell signals according to major trends. For example, traders might only use buy signals when the price is above the 50-period moving average and the opposite for sell signals.
Trend trading
Trend trading strategies often employ 1:30 and higher risk-reward ratios but have smaller win rates of around 36-40%. Traders might use the indicator in their trend-following methods by customizing RSI to filter out noise and false breakouts by setting the period on 14 or higher.
Forex RSI settings
Forex is very popular as it offers low spreads, and high leverage and is active 24/5 offering plenty of trading opportunities throughout the trading week. For smaller time frames it is better to use 9-period RSI coupled with moving averages for trend filtering. For higher timeframes, it is better to use 14-period RSI and ensure fewer false signals and fewer market noises.
Crypto RSI settings
Major cryptos like Bitcoin and Ethereum have gained popularity among retail traders and often mimic the price action of commodities and stocks. This opens up possibilities to deploy RSI-based strategies in crypto trading as well.
RSI period settings - How to apply and customize
Depending on your trading platform the steps to apply RSI to your chart might vary. However, since the most popular trading platforms are MetaTrader 4 & 5 we will explain how to apply RSI on your charts.
Applying RSI to your chart

In both trading platforms, the steps are exactly the same. Here are steps:
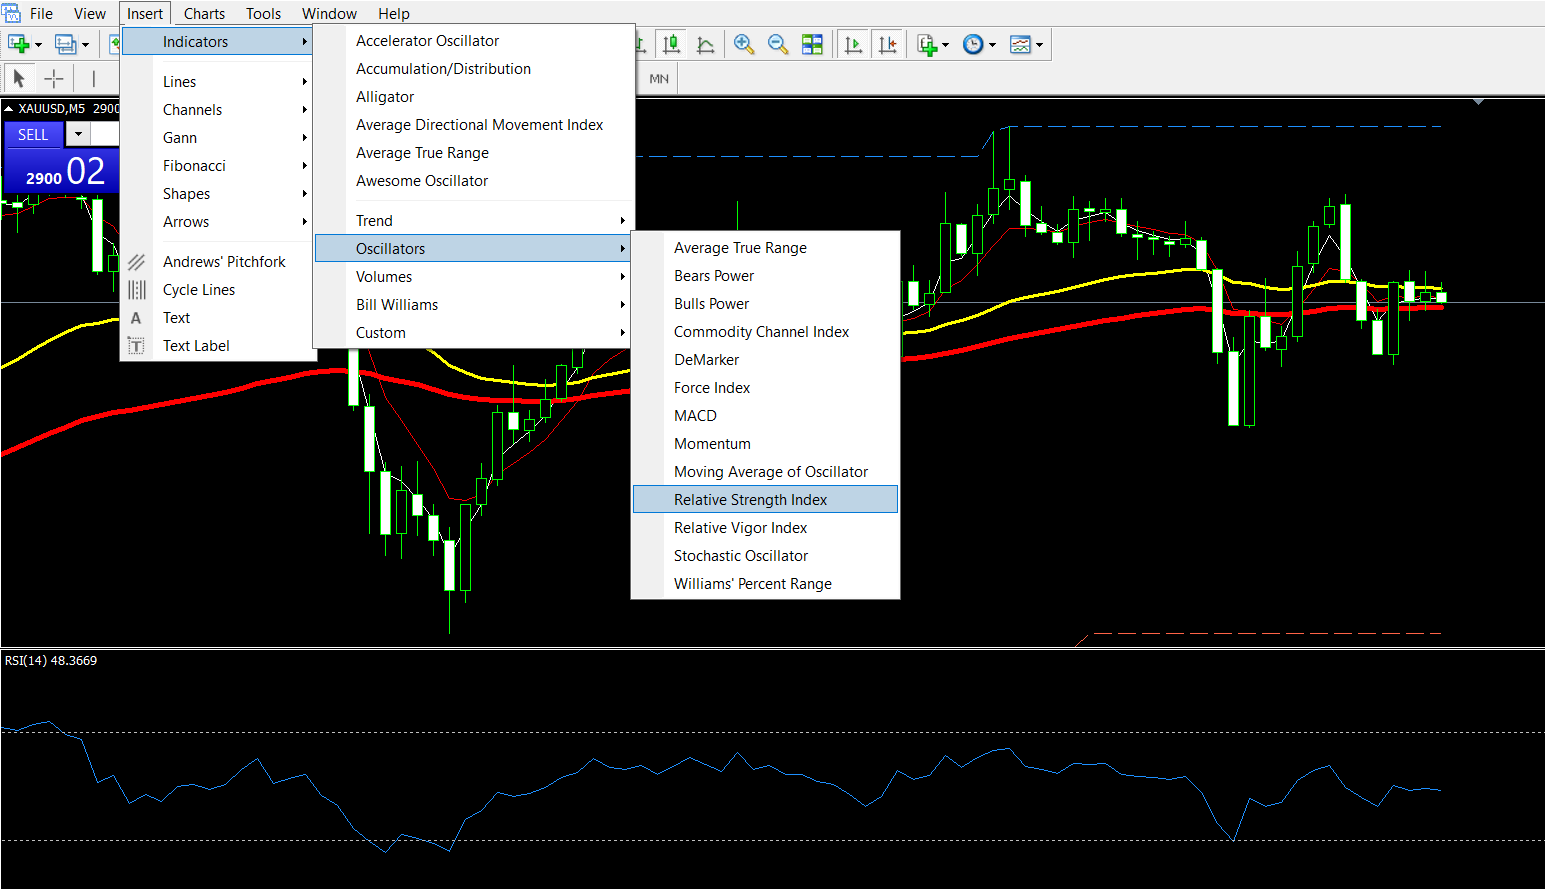
- Step 1. Click on Insert on the top menu
- Step 2. Select indicators, then oscillators, and there should be a Relative strength index
- Step 3. Click on it to apply
Customizing RSI - How to edit settings

After applying RSI to your chart, you can edit its settings with the following steps:
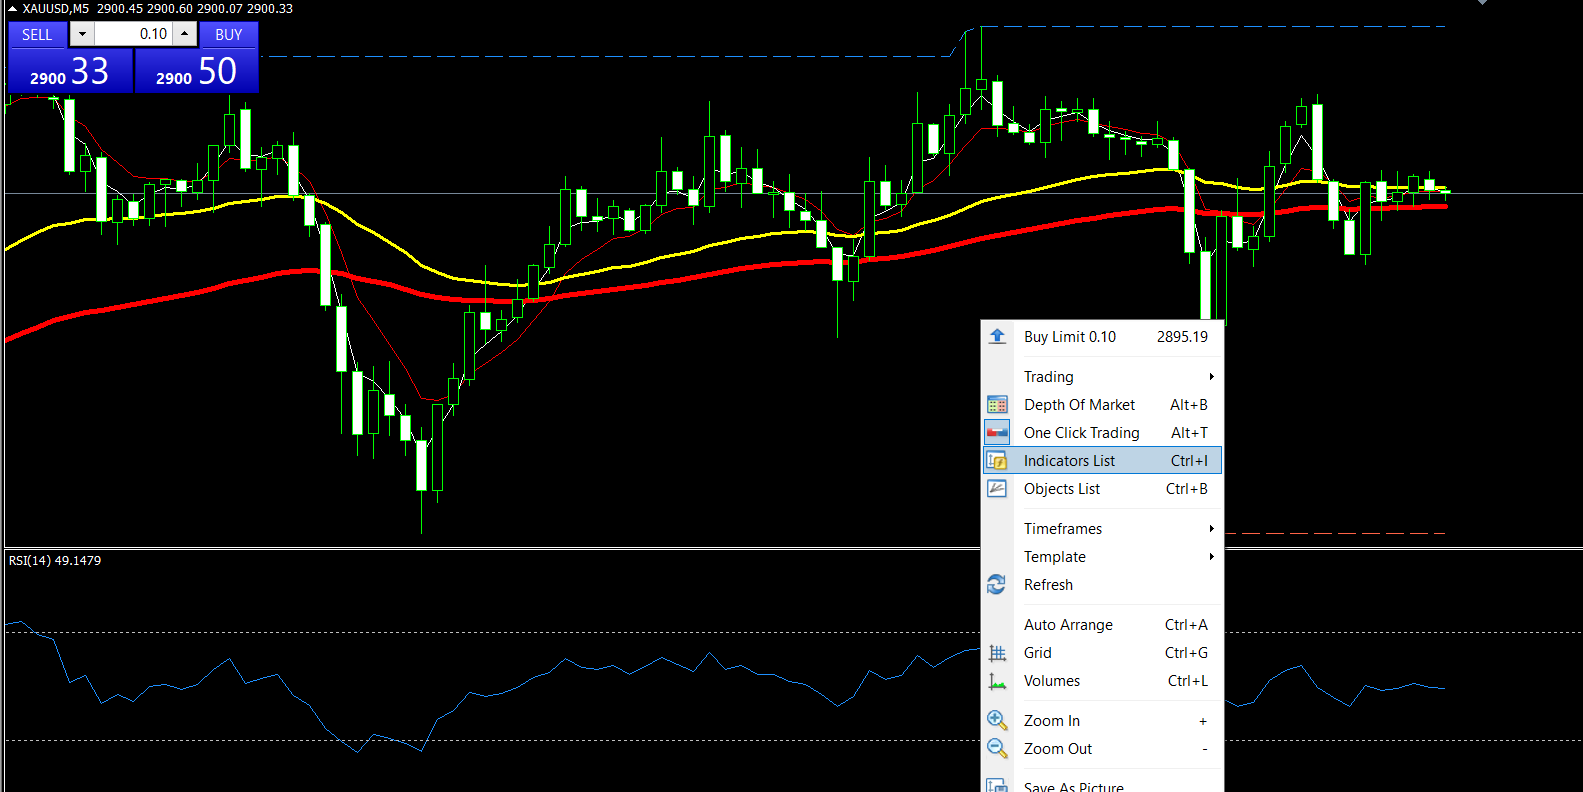
- Step 1. In MT4 or MT5, right-click on RSI > Settings | Or alternatively - Right-click anywhere on the chart > indicators list > double-click on RSI
- Step 2. Test various periods like 5-7 for scalping, loner 21 for commodities, and so on.
- Step 3. Change overbought and oversold levels to 75/25 in strong trends and test how accurate it will be.
Changing settings won’t do anything without extensive backtesting and forward-testing of your RSI trading techniques.
RSI backtesting and forward-testing
Ensure to scroll back to get enough price data to test if your strategy with the new RSI setting would be profitable on historical data. It is recommended to collect trading data of at least 25-30 trades to conclude whether your strategy would be profitable.
Unlike backtesting, forwardtesting tests the strategy’s performance on a demo account to ensure the method works in real market scenarios. This is crucial before applying a backtested strategy to live trading.
RSI overbought oversold - Context > Rules
Let’s remember why RSI oversold and overbought signals should not be used without context. In 2023, Nvidia’s stock rode RSI above 80 for weeks during the AI rally. Overbought? Yes. A sell signal? No. If there are powerful fundamentals at play like a bullish rally for some reason, it is a bad idea to short stocks and go against the main trend just because the RSI shows overbought levels. So, you should always try to combine RSI signals with the content and current major economic dynamics in financial markets.
Here are some rules for using RSI efficiently:
- In uptrends, buy RSI dips to 40-50
- In ranges, sell at 70, buy at 30
- In downtrends, Sell RSI rises to 70 and beyond
Combining fundamentals with technical analysis will give much more accurate signals. In the case of Nvidia’s rally caused by major AI hype, it would be the best approach to only take buy signals and ignore short signals.
RSI Divergence: Detecting early reversals
Divergences are powerful indicators of major price reversals. They indicate the reversal might be near and alert experienced traders to anticipate strong price movements. Divergence is when the price moves higher and makes higher highs, but RSI shows lower lows, indicating the momentum is waning and the price might reverse very soon.
- Bullis divergence - Price hits news lows, RSI doesn’t. Buy signal.
- Bearish divergence - Price peaks, RSI falters. Sell signal.
As with everything else in trading, RSI divergences are not 100% accurate. However, they can greatly enhance the trader’s accuracy and indicate that the current trading position might go into losses if the price moves in one direction but RSI does not agree with the price and trailers might want to set a stop loss to a new level to lock in profits or turn on the railing stop. (click on the open trade line on the chart and right-click to select the trailing stop loss amount).
It is critical that you use tight risk control when using the RSI divergence strategy. Just set the stop loss 2% below the entry or set it on recent price swings to reduce the probability of hitting the stop loss.
Combine RSI with these tools.
To increase the quality of RSI trading signals, ensure to combine it with other indicators. Traders can use moving averages, MACD, Bollinger bands, and others to increase the probability of higher-quality signals and reduce market noise.
Moving averages + RSI
Combine RSI with a 200-day moving average of simple type. This way, you will filter false trading signals and ensure you always trade in the direction of major price trends, avoiding false reversals.
MACD + RSI
MACD is another super popular indicator with the potential to enhance trading accuracy when combined with RSI. RSI divergence + AMCD crossover would be a very high probability trade and traders should use it to gain an edge in trading. MACD can also be found in oscillator lists like RSI and the process of applying and editing its settings is exactly the same as with RSI.
Common RSI mistakes
Since RSI is a very popular indicator and many beginners use it, it is essential to ensure you avoid common pitfalls:
Using RSI alone. Ensure to pair it with price action or with other indicators.
Selling at 70 in a bull market is another common beginner mistake. Remember that trends trump levels.
Final word
The best RSI settings do not exist. The best settings depend on your trading strategy, asset class, time frame, and grit to test. For beginners, it is recommended to start with RSI for day trading, and RSI 14 for swings. Backtest, forward-test, repeat. Traders should also combine RSI with other powerful indicators to filter false signals and trade only in the direction of a major trend. This is why it is important to combine RSI technical analysis with fundamentals and only then try to make trading decisions.
FAQs on RSI Indicator Settings: The Best Configurations for Maximum Trading Accuracy
What is the best RSI setting for scalping?
RSI scalping settings depend on the trading strategy style and timeframe. Smaller periods will give more frequent signals while longer periods like 14 and beyond will show fewer signs and fewer false alarms.
Can RSI work alone, or do I need other indicators?
No indicator can work standalone without combining it with other indicators and fundamental analysis.
How to avoid false RSI signals in sideways markets?
Use longer periods like the ones used in RSI swing trading in our guide to ensure fewer false signals. 14-period RSI is better than 9-period.