Weekly Market Commentary | 15.07 - 21.07
15 July 2024

Curious to know what’s happening on the markets this week? Take a quick tour of the latest news, economic updates, and trading setups that will keep you up-to-date and in the know!
Monday
-
A busy start with China's GDP below expectations, but industrial production exceeding forecasts. Later, the US Empire State Manufacturing Index is expected at -5.5 and Jerome Powell's speech post-European session could impact markets.
Tuesday
Wednesday
Thursday
Friday
Setups for This Week:
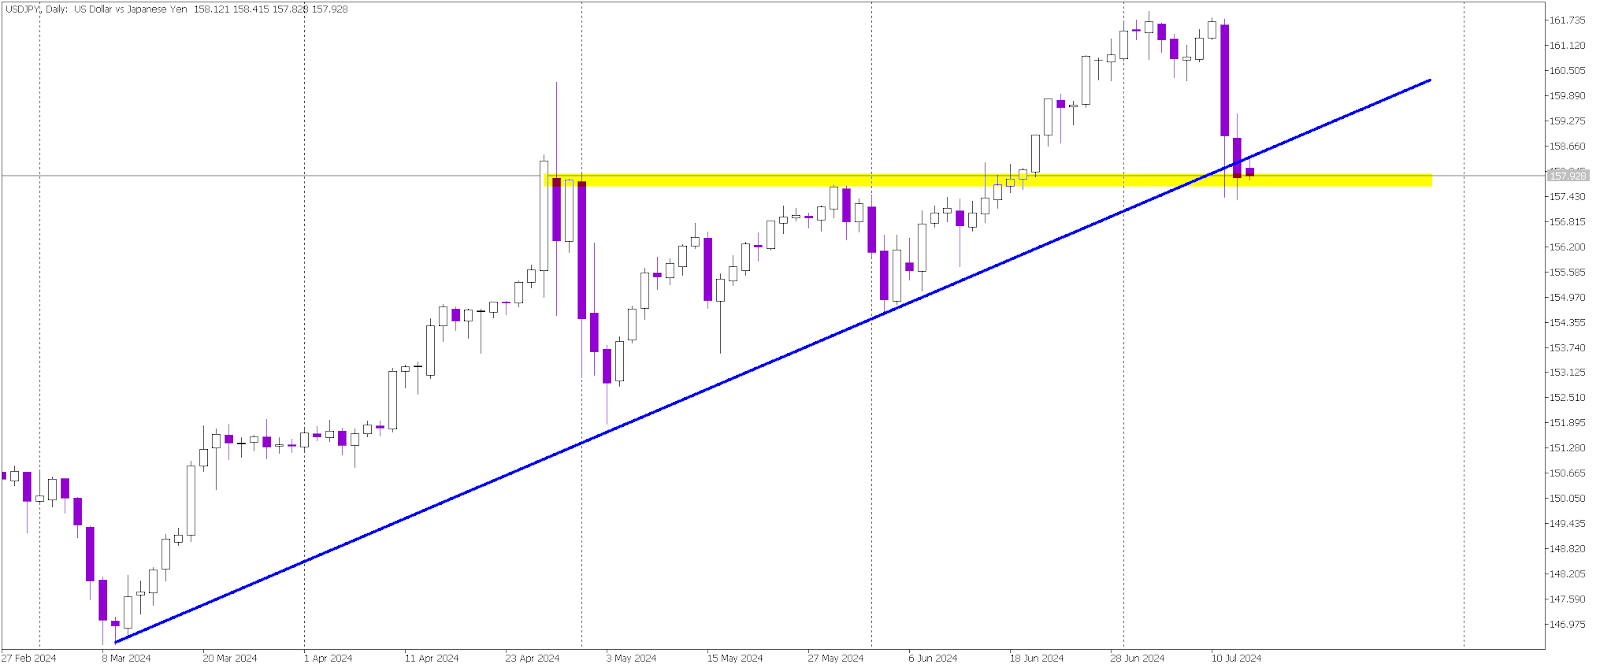
USDJPY
-
Primary View: The price is currently fighting on the long-term uptrend line and yellow horizontal support. Price breaking below that will be a signal to sell.
-
The long-term uptrend line provides crucial support.
-
The yellow horizontal support has been tested multiple times, indicating its significance.
-
Alternative View: Price coming back above the blue uptrend line and bouncing off yellow horizontal support would be a buy signal.
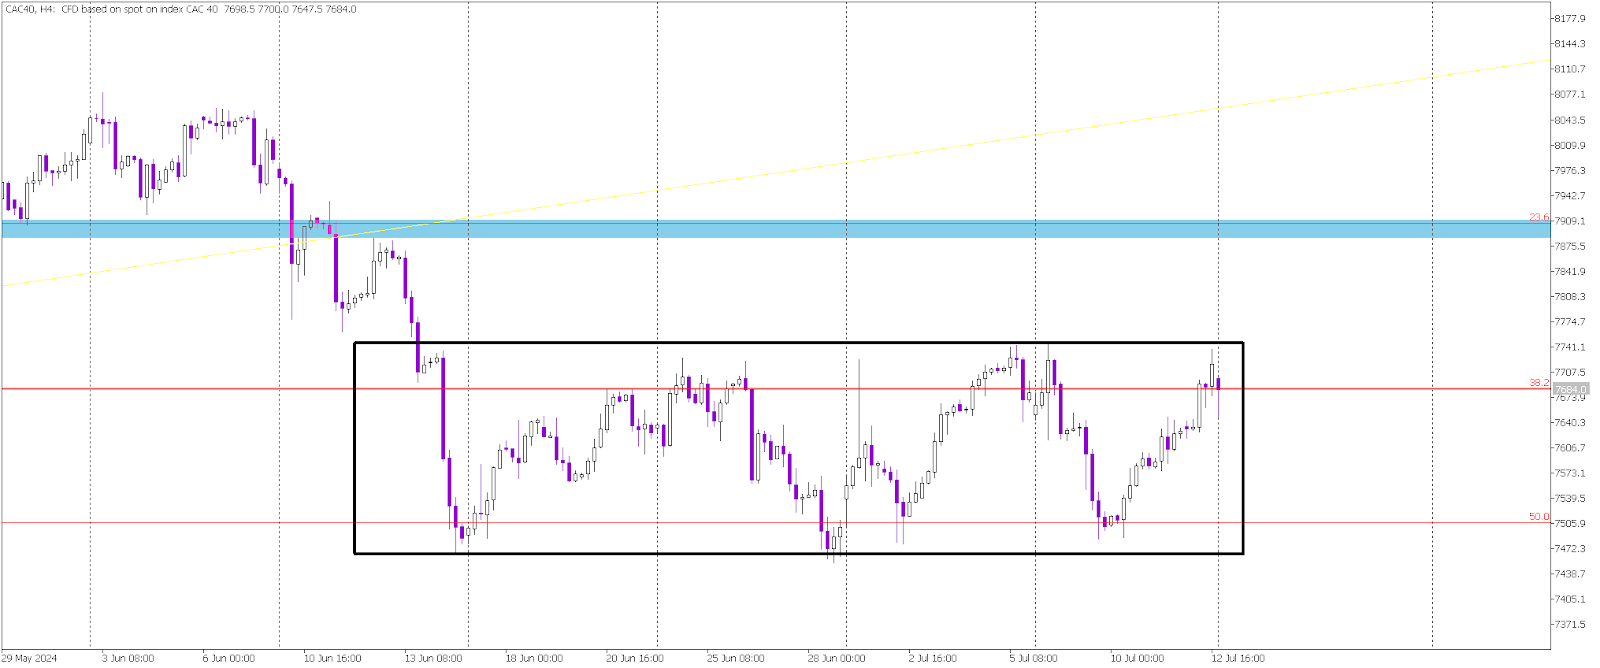
CAC 40
-
Primary View: The price is still inside the sideways trend marked as a black rectangle. As long as we stay below the upper line of the rectangle, there is a short-term sell signal.
-
Alternative View: Price breaking from the rectangle to the upside would be a signal to buy.
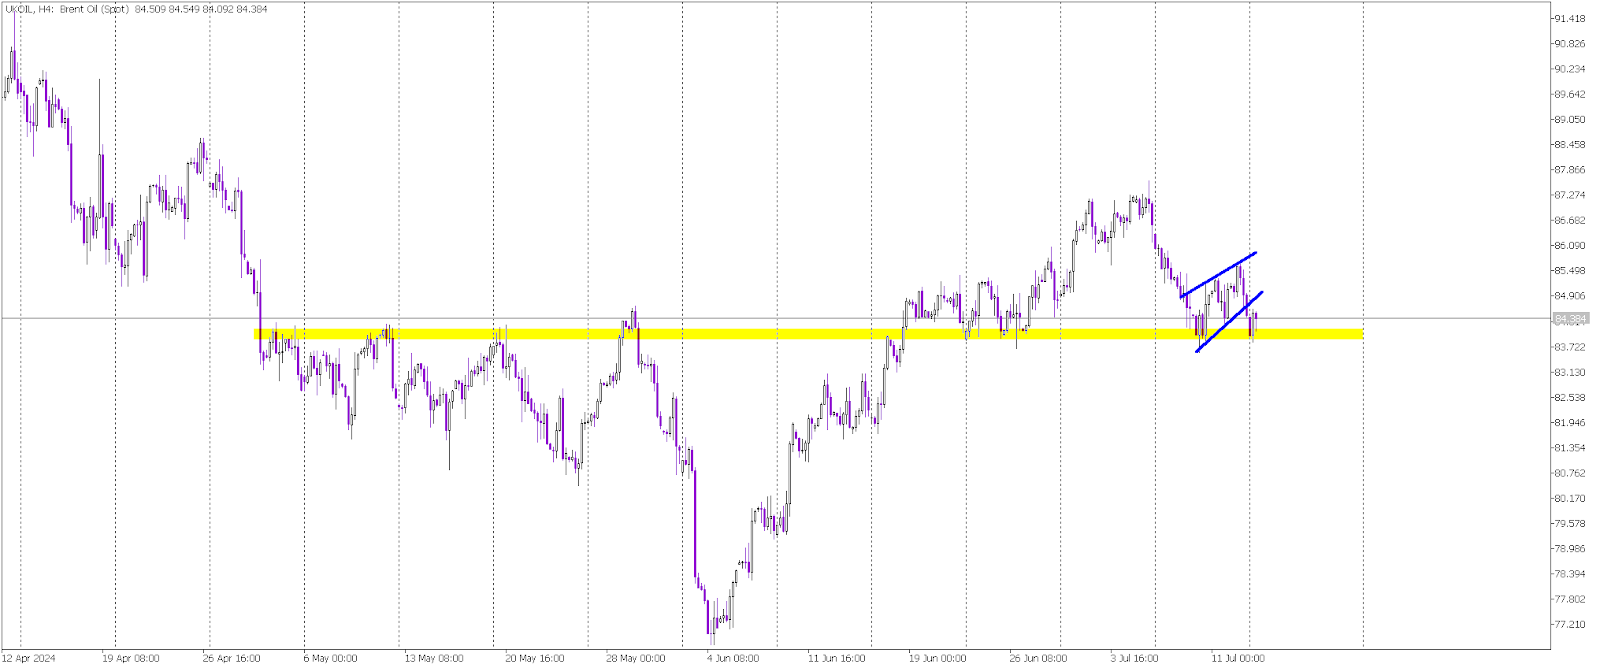
Brent Oil
-
Primary View: The price is protecting and bouncing over key horizontal support marked with yellow color. As long as we stay above, there is a signal to buy.
-
Alternative View: Price breaking below the yellow support would be a signal to sell.