Weekly Market Commentary | 22.07 - 28.07
22 July 2024

Curious to know what’s happening on the markets this week? Take a quick tour of the latest news, economic updates, and trading setups that will keep you up-to-date and in the know!
Monday
-
Markets are digesting the unexpected news of Joe Biden dropping out of the presidential race.
-
China's central bank surprised the market by cutting the short-term seven-day reverse repurchase rate from 1.8% to 1.7%.
Tuesday
Wednesday
-
A busy day filled with PMI releases from major economies:
-
Additionally, the Bank of Canada will announce its interest rate decision, expected to decrease from 4.75% to 4.5%.
Thursday
Friday
Setups for This Week:
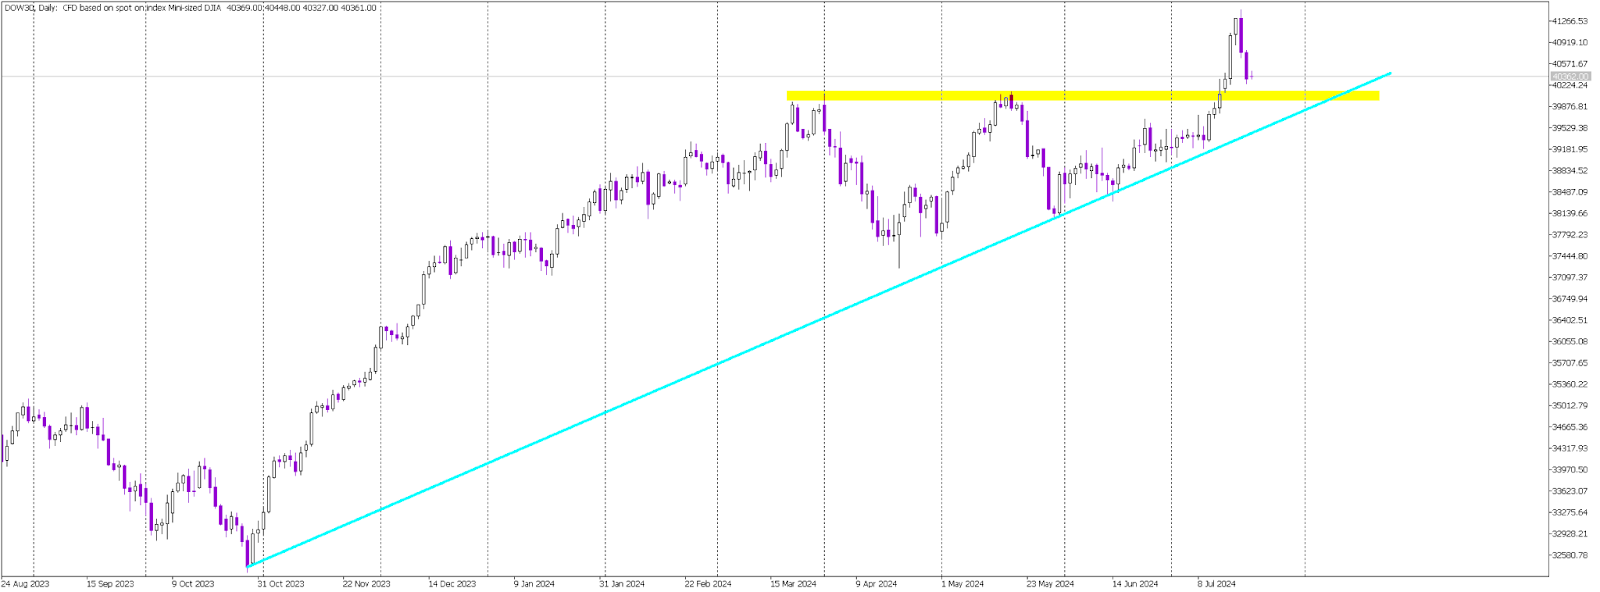
Dow Jones
Primary View:
-
The last two days have been significantly bearish, indicating the start of a bearish correction.
-
The price is nearing key yellow horizontal support and the blue uptrend line. A bounce from these levels would signal a buy opportunity.
Alternative View:
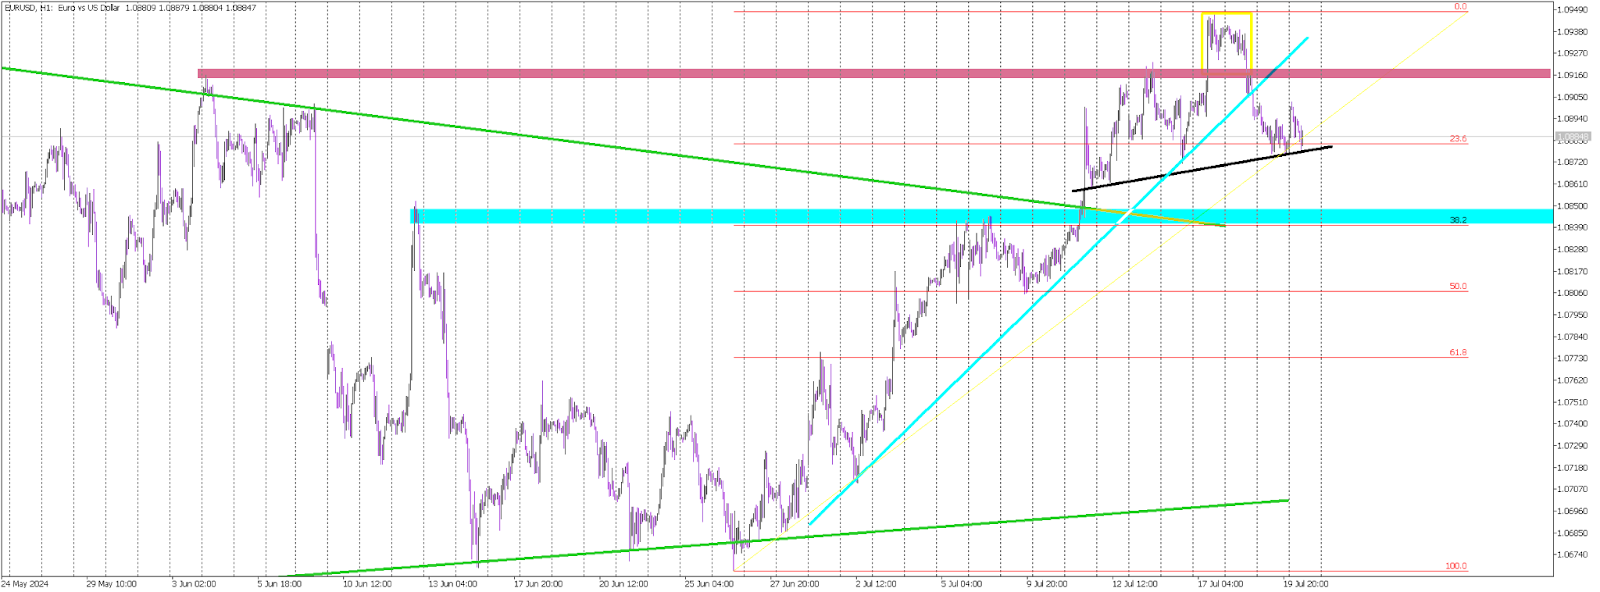
EUR/USD
Primary View:
Alternative View:
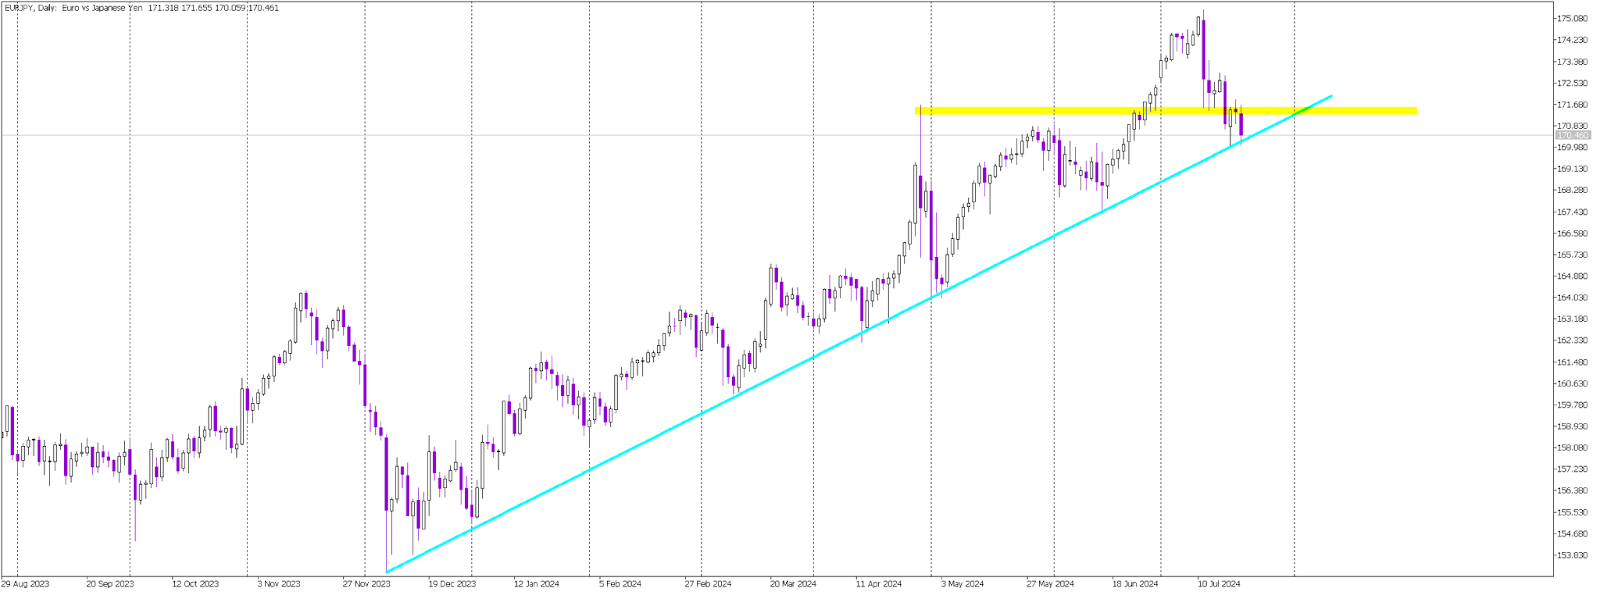
EUR/JPY
Primary View:
Alternative View: