Weekly Market Commentary | 29.04 – 05.05
29 April 2024

Curious to know what’s happening on the markets this week? Take a quick tour of the latest news, economic updates, and trading setups that will keep you up-to-date and in the know!
Monday
- German CPI: The week starts quietly with only the German Consumer Price Index (CPI) anticipated, expected at 0.6%.
Tuesday
- Manufacturing and Non-Manufacturing PMIs from China: Both indices are forecasted to remain above the 50 threshold, indicating expansion.
- Eurozone CPI Flash Estimate: Expected to be at 2.4%.
- Canadian GDP: Projected to post a 0.3% increase.
- US CB Consumer Confidence: Anticipated to come in at 104.
- Earnings Reports: Key reports expected from Amazon, AMD, Coca-Cola, and McDonald's.
Wednesday
- New Zealand Job Data: To start the day’s data releases.
- US ADP Non-Farm Employment Change: An important prelude to Friday’s non-farm payrolls.
- European Markets: Most will be closed.
- US Manufacturing PMIs and Job Openings: Further insights into economic activity and labor market.
- US Interest Rate Decision: Expected to remain steady at 5.5%, with a subsequent statement and press conference.
- Earnings Reports: Key results expected from Mastercard, Qualcomm, and Pfizer.
Thursday
- Swiss Inflation Data: Continues the week’s focus on inflation metrics.
- US Unemployment Claims: Weekly data to provide updates on the labor market.
- Apple Earnings: Highly anticipated results that could impact market sentiments.
Friday
- Bank Holidays: Quiet day expected in Asian markets with Japan and China observing holidays.
- US Non-Farm Payrolls: Expected at 243,000, a crucial indicator of employment health.
- US ISM Services PMI: Forecasted at 52, indicating continued expansion in the service sector.
Setups for This Week:
Gold
Primary View:
- The price of gold has formed a flag pattern, which is highlighted by red lines.
- A close below the lower red line would serve as a sell signal.
Alternative View:
- If the price breaks above the upper red line, it would be considered a buy signal.
 USD/CAD
Primary View:
- The price is on a downward trend, constrained by a red downtrend line.
- Approaching a yellow horizontal support, a rebound off this support combined with a break of the red downtrend line would signal a buying opportunity.
Alternative View:
- A break below the yellow horizontal support line would be a sell signal.
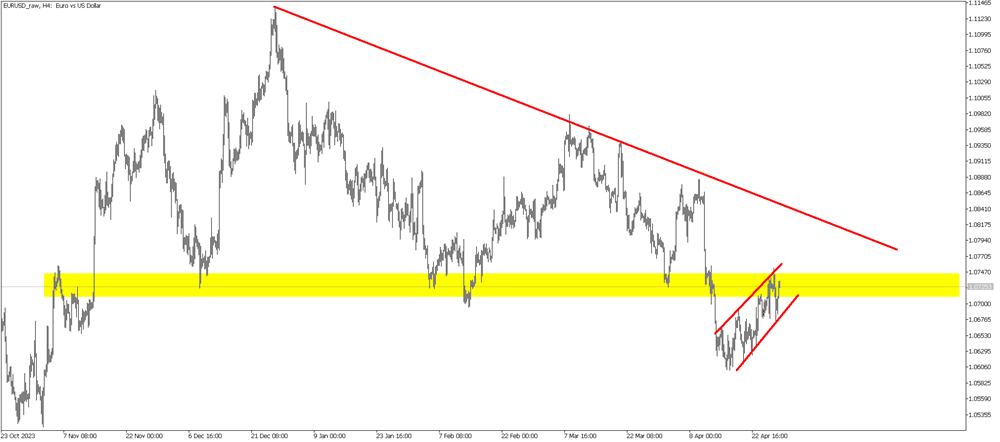
 EUR/USD
Primary View:
- The price is currently trading within a flag pattern and is at a horizontal resistance level.
- A move above this resistance would trigger a buy signal.
Alternative View:
- A rejection from the horizontal resistance and a break below the lower line of the flag pattern would be a strong sell signal.
