Weekly Market Commentary | 22.01 – 28.01
22 January 2024

Curious to know what’s happening on the markets this week? Take a quick tour of the latest news, economic updates, and trading setups that will keep you up-to-date and in the know!
Monday:
- Quiet start to the week on the charts, with American indices at all-time highs.
- Empty macro calendar, no significant economic data releases scheduled.
Tuesday:
- Focus shifts to Japan with several key events:
- Interest rate decision (rates expected to remain unchanged).
- Monetary policy statement and outlook report from the Bank of Japan.
- Press conference following the Bank of Japan's announcements.
- New Zealand inflation data release:
- Quarterly inflation expected to decrease from 1.8% to 0.5%.
Wednesday:
- Busy day with PMIs from leading economies:
- PMIs from France, Germany, Eurozone, UK, and the US.
- Only the UK and US flash services PMIs expected to be above 50.
- Other PMIs anticipated to fall below the 50 threshold.
- Interest rate decision from the Bank of Canada:
- Rates expected to hold steady at 5%.
Thursday:
- Another key interest rate decision:
- European Central Bank expected to maintain current rates.
- Advanced GDP data from the US:
- Forecasted to show a 2% rise.
- European Central Bank press conference following the interest rate decision.
Friday:
- Quieter end to the week:
- Tokyo Core CPI expected to decrease to 1.9%.
- Core PCE price index from the US:
- Predicted to rise to 0.2%.
Setups for This Week:
AUDJPY
- Primary View:
- Formation of a shooting star candlestick pattern (blue color).
- Located at the high from early January and December highs (green color).
- A drop below the shooting star indicates a bearish reversal, signaling a sell opportunity.
- Alternative View:
- If the price climbs back above the yellow line, it would indicate a buy signal.
 NZDUSD
- Primary View:
- Currently in a sideways trend (green color).
- Maintaining position above key horizontal support (blue color).
- Positive sentiment as long as the price remains above the blue support line.
- Alternative View:
- A daily close below the blue support area would trigger a sell signal.
 WTI Oil:
- Primary View:
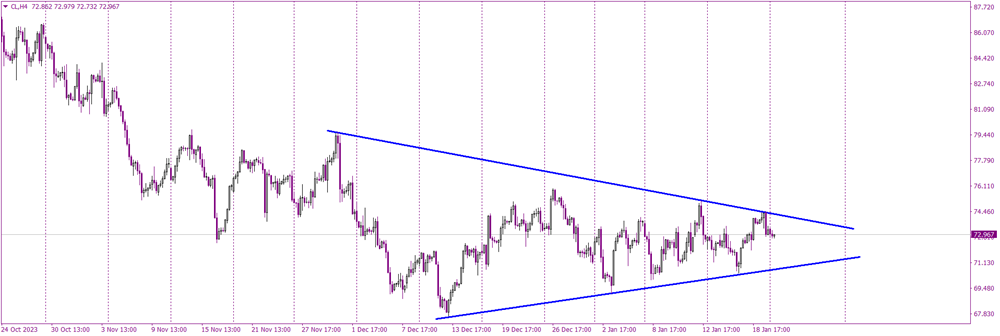
- Trading within a symmetric triangle pattern (blue lines).
- A breakout above the upper line of the triangle would be a buy signal.
- Alternative View:
- Closing below the lower line of the triangle would be a sell signal.
