Weekly Market Commentary | 22.07 - 28.07

Weekly Market Commentary | 22.07 - 28.07
Curious to know what’s happening on the markets this week? Take a quick tour of the latest news, economic updates, and trading setups that will keep you up-to-date and in the know!

Monday

  • Markets are digesting the unexpected news of Joe Biden dropping out of the presidential race.

  • China's central bank surprised the market by cutting the short-term seven-day reverse repurchase rate from 1.8% to 1.7%.

Tuesday

  • The day is expected to be quiet with only two major economic data points:

    • Existing home sales from the US, anticipated to be just under 4 million.

    • Richmond Manufacturing Index, forecasted at minus 7.

Wednesday

  • A busy day filled with PMI releases from major economies:

    • Eurozone, UK, and US will report their PMIs, providing insights into economic health.

  • Additionally, the Bank of Canada will announce its interest rate decision, expected to decrease from 4.75% to 4.5%.

Thursday

  • Key economic indicators will be released, including:

    • GDP from the US, projected at 1.9%.

    • Durable goods orders from the US.

    • The day will wrap up with a speech from ECB President Christine Lagarde.

Friday

  • The week concludes with significant data releases:

    • Tokyo Core CPI, expected at 2.2%.

    • Core PCE Price Index from the US, expected at 0.2%.

    • Revised University of Michigan Consumer Sentiment, anticipated at 66.6.


Setups for This Week:

Dow Jones

Primary View:

  • The last two days have been significantly bearish, indicating the start of a bearish correction.

  • The price is nearing key yellow horizontal support and the blue uptrend line. A bounce from these levels would signal a buy opportunity.

Alternative View:
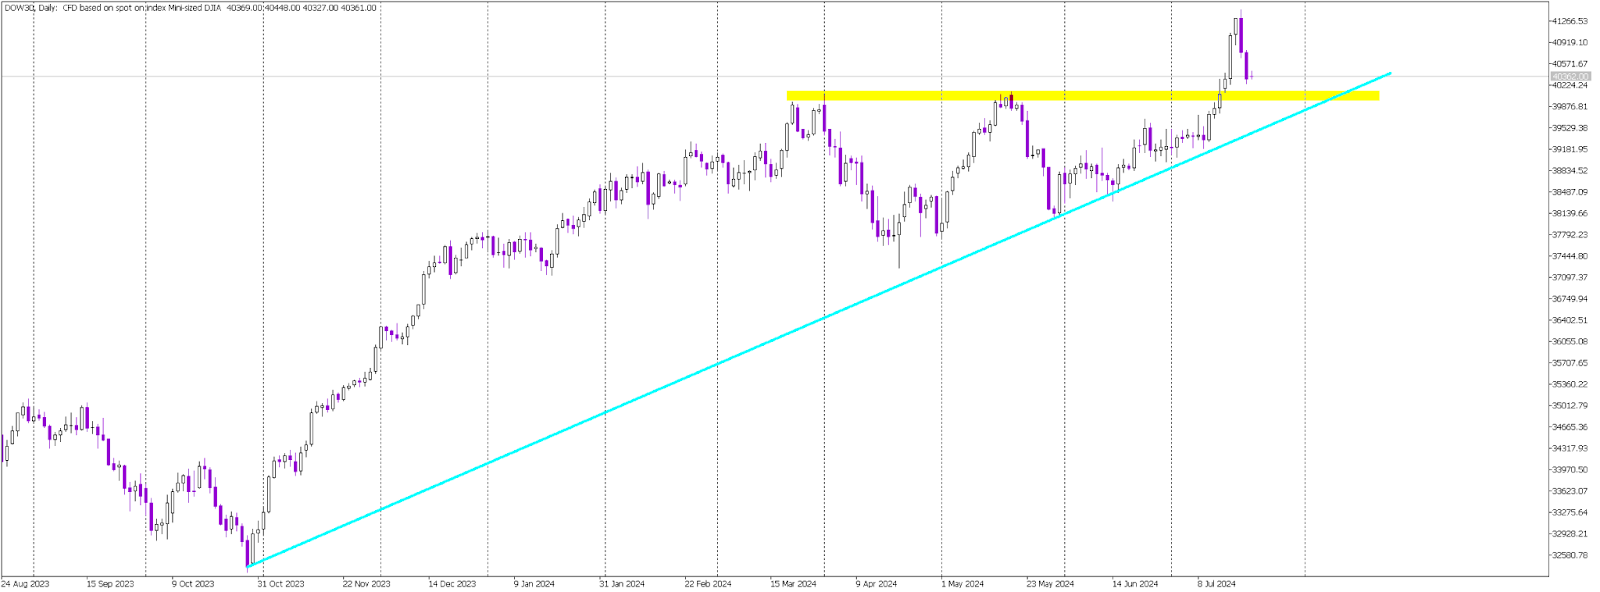
  • If the price breaks these supports and closes the week below them, it will be a strong sell signal.

EUR/USD

Primary View:

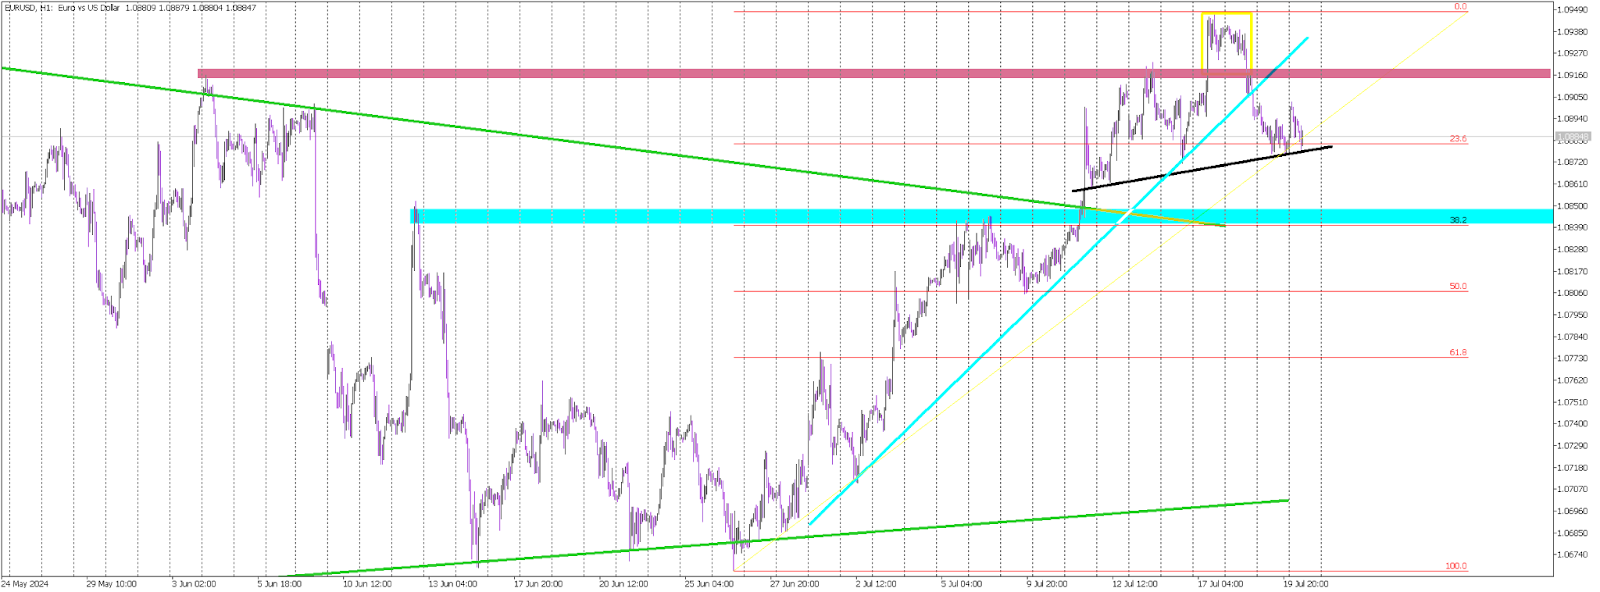
  • The price is forming a head and shoulders pattern with a black neckline. Breaking this neckline would signal a sell, targeting the blue horizontal support at 30.2% Fibonacci.

Alternative View:

  • A bounce off the black neckline and a move above the purple resistance would signal a buy.

EUR/JPY

Primary View:

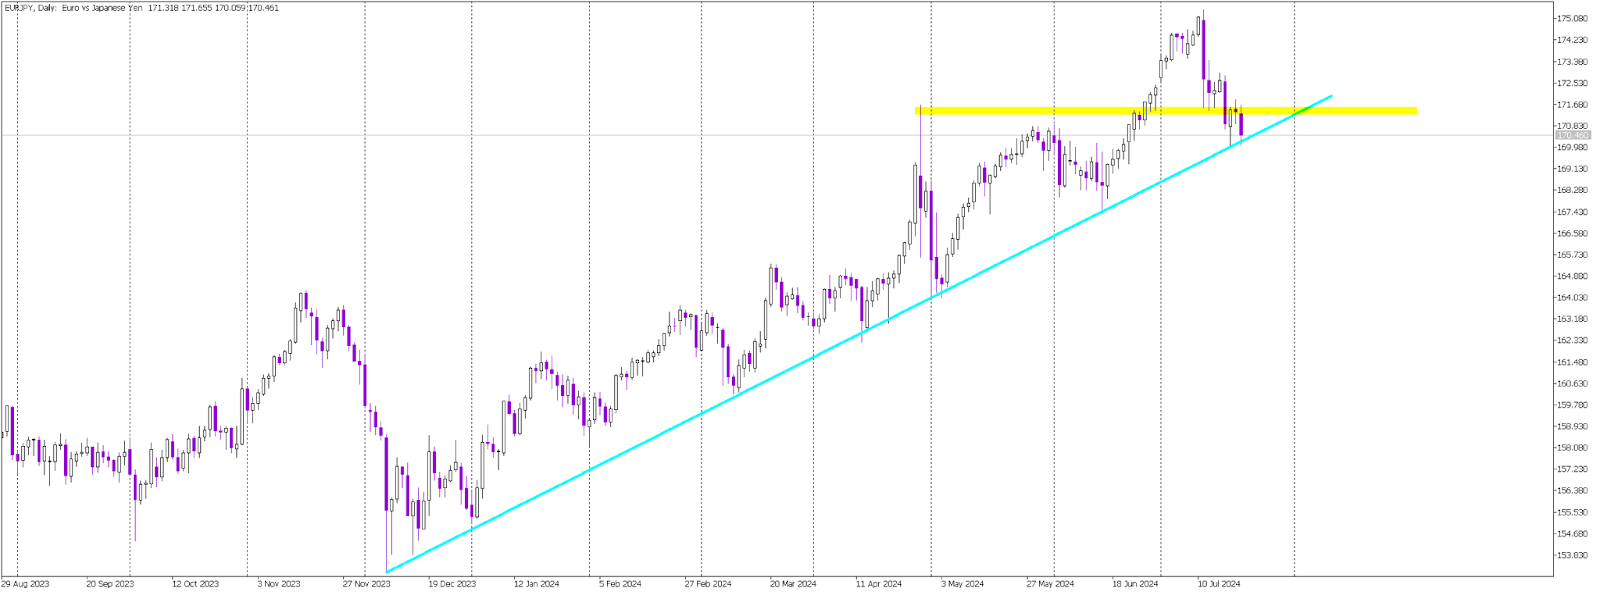
  • The price is testing a crucial dynamic long-term uptrend line marked in blue. A bounce and formation of a hammer candle, followed by a move above the yellow resistance, would signal a buy.

Alternative View:

  • Closing the day below the blue uptrend line would be a strong sell signal.

Show More Articles
Axiory uses cookies to improve your browsing experience. You can click Accept or continue browsing to consent to cookies usage. Please read our Cookie Policy to learn more.