Example of an EMA strategy
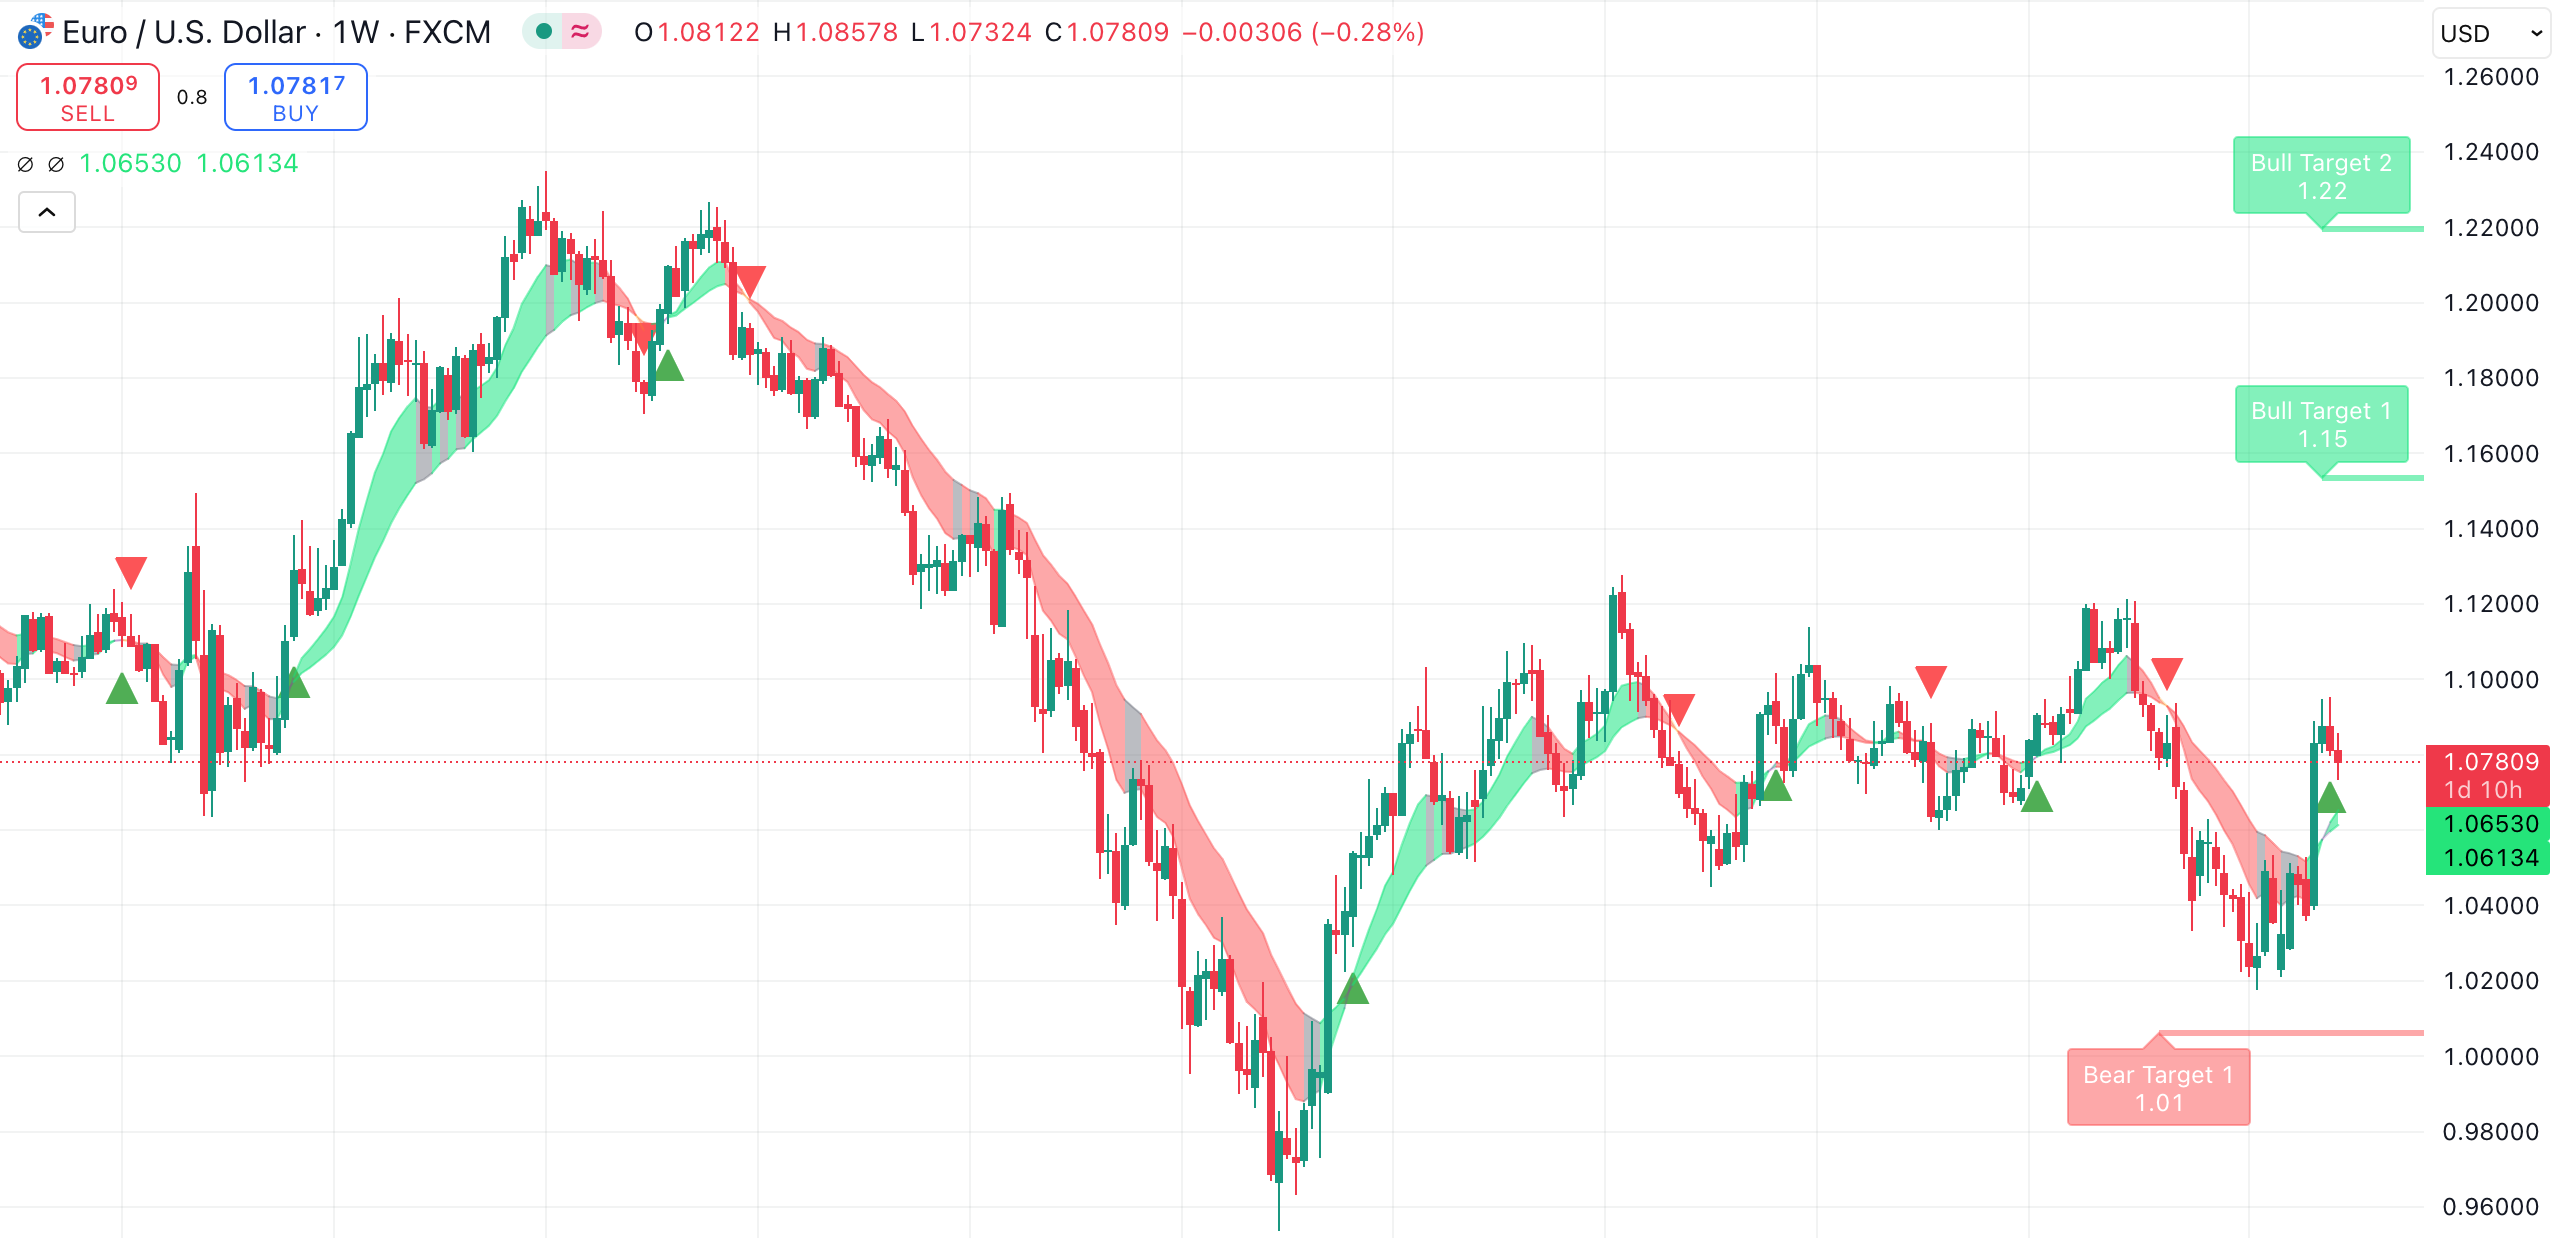
We can look at a practical example of a basic Exponential Moving Average trading strategy by plotting two periods on the price chart of EUR/USD, which is one of the most actively traded assets on the global forex market.
For an EMA strategy to work, we will need two different periods. For the sake of simplicity, let’s pick a 9-period EMA as our fast EMA and a 21-period one as the slow EMA.
Step 1: Setting up the chart
You can choose between a 15-minute, 1-hour, or 4-hour time frame (depending on your trading style).
Plot two EMAs on the EUR/USD price chart (9-EMA and 21-EMA):

Step 2: Entry Rules
Buy Singal (Bullish Crossover)
- A buy signal is generated when the 9-EMA crosses above the 21-EMA, which signals an uptrend
- Wait for the candle to close above both EMAs to confirm the trend
- Enter a long (buy) position at the next candle’s opening
Stop-Loss and Take-Profit:
- Place a stop-loss order below the recent swing low (10-20 pips away)
- Aim for a 1:2 risk-reward ratio for the take-profit order, or close the trade when the price starts to move sideways
Sell Signal (Bearish Crossover)
- A bear signal is generated when the 9-EMA crosses below the 21-EMA, which signals a downtrend
- Wait for the candle to close below both EMAs
- Enter a short (sell) position at the next candle’s opening
Stop-Loss and Take-Profit:
- Place a stop-loss order above the recent swing high (10-20 pips away)
- Aim for a 1:2 risk-reward ratio for the take-profit order or exit when the price consolidates
Using stop-loss and take-profit orders is essential to cover the risk associated with relying on technical indicators to time the market. No technical indicator is flawless, which is why it is always advisable to use appropriate risk management techniques.
Step 3: Additional Confirmations
Using the EMAs to generate bullish and bearish signals can be unreliable and prone to false signals, which is why the EMA strategy is often used in conjunction with other technical and fundamental indicators, such as:
- The RSI (Relative Strength Index) - Ensure the RSI is above 50 for long trades and below 50 for short positions
- Support and Resistance levels - Avoid entering trades near major support and resistance levels
- News events - Be cautious during major news events, as they can cause volatility to spike
Using EMAs in MetaTrader
The EMA is particularly popular among MetaTrader users, as the platform provides flexibility and a range of technical indicators that are free to use alongside them.
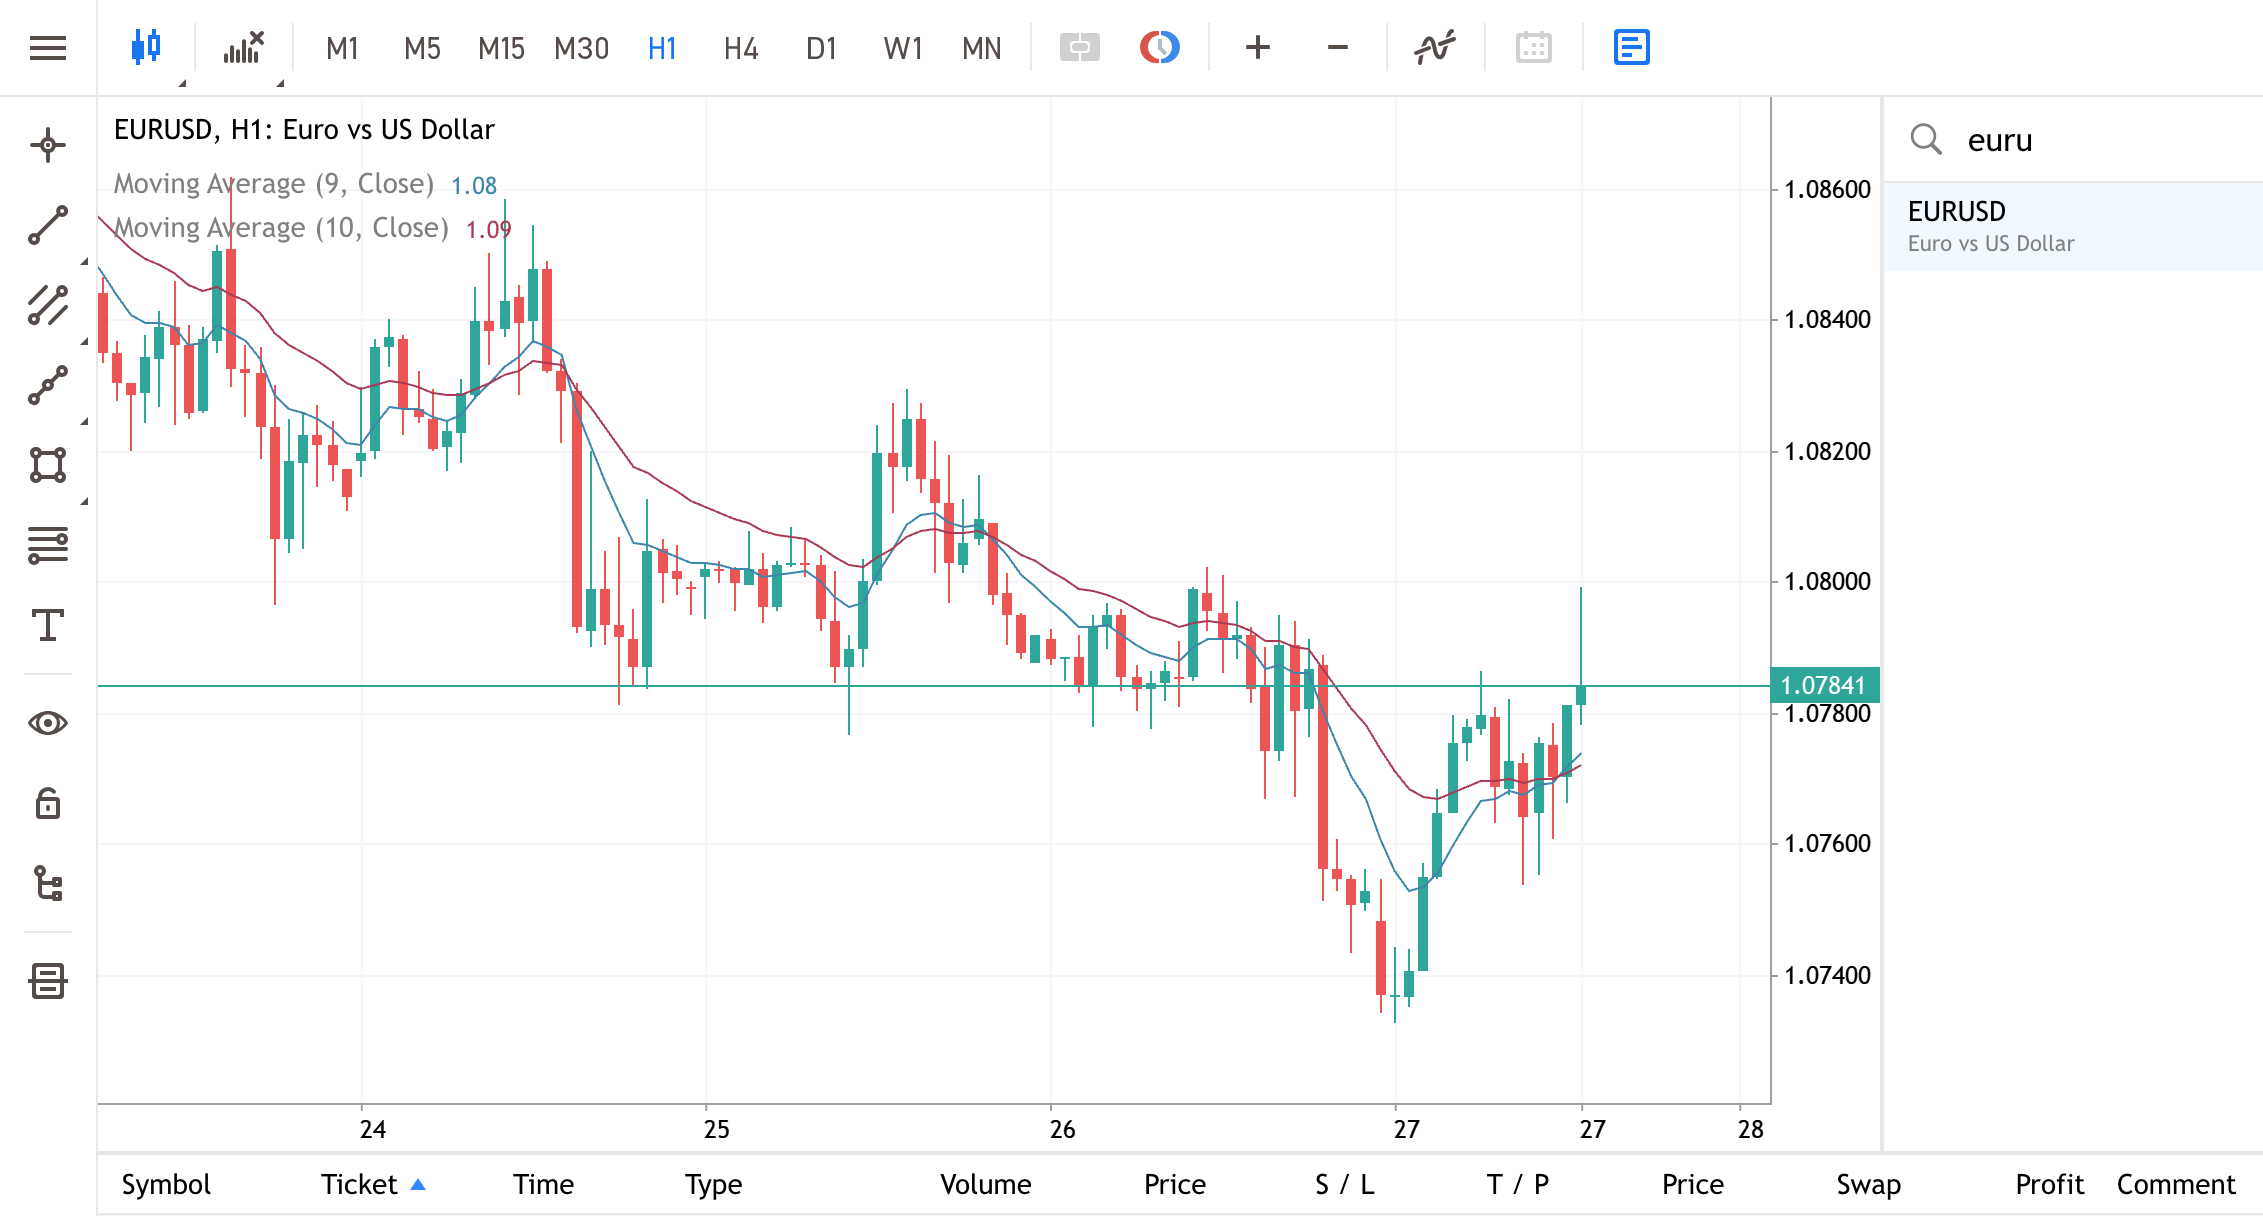
To continue our example, we can look at the MT4 Exponential Moving Average of 9-EMAs and 21-EMAs, respectively, plotted on the EUR/USD price chart:

You can create a chart like this on the MetaTrader 4 web trader by following these simple instructions:
- Launch the MetaTrader web app and choose the EUR/USD pair to view the price chart
- Go to the indicators menu and choose “moving average”
- Modify the moving averages as exponential moving averages, with periods of 9 and 21 and plot them on the chart
Now you will be able to use your interpretation of the Exponential Moving Average (EMA) to analyze the EUR/USD price chart.
Step 1: Identify trend direction
You can use the indicator to understand the direction of the price trend:
- If the price is above the EMA and and EMA is sloping upward, the market is in an uptrend
- If the price is below the EMA and the EMA is sloping downward, the market is in a downtrend
- If the price fluctuates around the EMA without clear direction, the market is ranging
Another common practice is to use a 200-period EMA on higher time frames, such as 1-hour, 4-hour, or 1-day, to determine the overall market trend.
If the price is above the 200 EMA, traders generally look for buy opportunities, and if it’s below, they consider selling.
Step 2: Using the EMA crossover to generate signals
As we have already mentioned in our previous example, bullish and bearish crossovers can be generated using the two EMAs:
- The 9-period (short) EMA reacts quickly to price changes
- The 21-period (long) EMA reacts slower and smooths out long-term trends
Step 4: Using EMAs as dynamic support and resistance levels
You can find long-term support and resistance levels on a price chart by using the longer-period exponential moving average MetaTrader provides, which you can customize to fit the periods that you may be interested in.
For example, you can use 50 and 200 EMAs as short and long EMAs, which gives you trend information:
- In an uptrend, the price may pull back to the 50 EMA or 200 EMA before continuing upward
- In a downtrend, the price may retest the EMA and continue falling
This works particularly well with the Relative Strength Index, which measures the strength of the current price trend and the potential for a reversal/continuation of the trend.
To use this strategy effectively in trading:
- Buy near the EMA in an uptrend when the price touches or slightly dips below it
- Sell near the EMA in a downtrend when the price tests it from below
- Combine this with price action (candlestick patterns, such as the pin bars or engulfing candles) for more reliable data
Step 5: Use the EMAs with other technical indicators
To improve the accuracy of the signals generated by your EMA strategy, use it with other indicators, such as:
- The Relative Strength Index (RSI) - If the price crosses above the EMA and RSI is above 50, it confirms a buy signal, conversely, If the price crosses below the EMA and RSI is below 50, it confirms a sell signal
- Moving Average Convergence Divergence (MACD) - A bullish EMA crossover along with a MACD bullish signal strengthens the buy confirmation. On the other hand, A bearish EMA crossover with a MACD bearish signal strengthens the sell confirmation
- Fibonacci Retracement - EMAs often align with Fibonacci Retracement Levels (e.g., 38.2% or 61.8%), reinforcing entry points
Overall, the EMA is a useful tool that helps traders analyze price trends and generate buy and sell signals on the chart. For more accuracy, EMAs are used with other prevalent indicators to reduce the risk of false signals.
Key takeaways from What is an Exponential Moving Average
- The Exponential Moving Average is a technical indicator that gives more weight to recent price data, making it more responsive to price changes than the Simple Moving Average
- EMAs indicate overall trend direction, potential entry/exit points, and dynamic support/resistance levels
- EMAs are useful for identifying trends but can generate false signals in sideways markets; they work best when paired with the RSI, or the MACD
- Strategies using 9 and 21 EMAs, or 50 and 200 EMAs, are commonly used in forex trading, depending on the time frame chosen by the trader
- Longer EMAs act as dynamic support and resistance levels where price often reacts, making them useful for trend continuation strategies
- Stop-losses and take-profit orders are crucial in managing risk when using the EMA trading strategy
FAQ on Exponential Moving Averages
Are Exponential Moving Averages reliable?
Exponential Moving Averages, or EMAs, are reliable in identifying trends and dynamic support/resistance levels, especially in trending markets.
However, they lag behind price action and can produce false signals in sideways or choppy markets. For better accuracy, traders often use EMAs with other indicators, such as the RSI and the MACD.
What do Exponential Moving Averages show?
Exponential Moving Averages show the smoothed price trend of an asset by giving more weight to recent prices. They help traders identify the direction of a trend, potential entry and exit points, and support/resistance levels. EMAs are especially useful in spotting trend reversals and filtering out market noise.
What can I use with Exponential Moving Averages?
Since Exponential Moving Averages often generate false signals on their own, they are often used in tandem with other indicators, such as the Relative Strength Index (RSI) and the Moving Average Convergence Divergence, or the MACD, to generate more accurate bullish and bearish signals.
How is an Exponential Moving Average different from a Simple Moving Average?
An EMA differs from a SMA by giving more weight to recent prices, making it more responsive to price shifts. In contrast, an SMA assigns equal weight to all data points in a period, making it slower to react to new trends and market reversals.